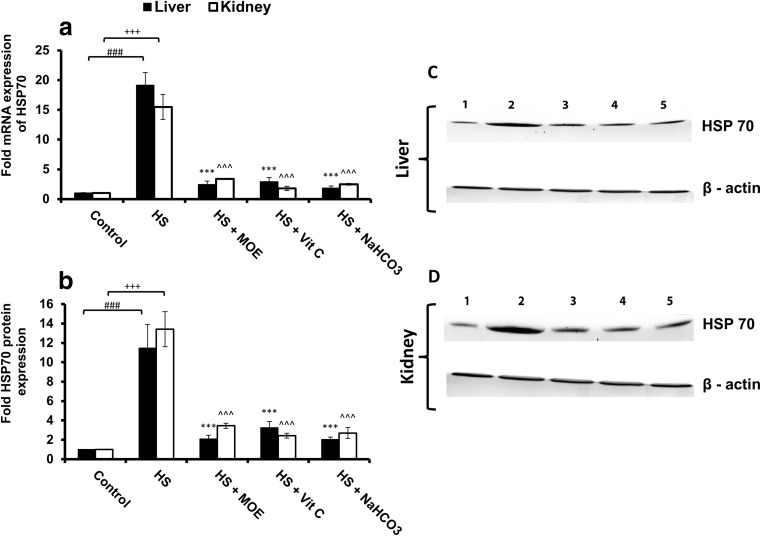
Fig. 1.
Effect of MOE, Vit C, and NaHCO3 on HS-induced mRNA (a; n = 9) and protein expressions of HSP70 in both of liver (c) and kidney (d) tissues. The band intensities in western blotting were also represented (b; n = 9). HS increased (p < 0.001) the expression of mRNA and protein in both tissues versus control group, while MOE, Vit C, and NaHCO3 decreased (p < 0.001) the expression of HSP70 on both mRNA and protein levels versus HS group. # & + represent the degree of significance between the liver and kidney in HS group, respectively, and control, while * & ^ represent the difference between treatments in the liver and kidney, respectively, with HS group

