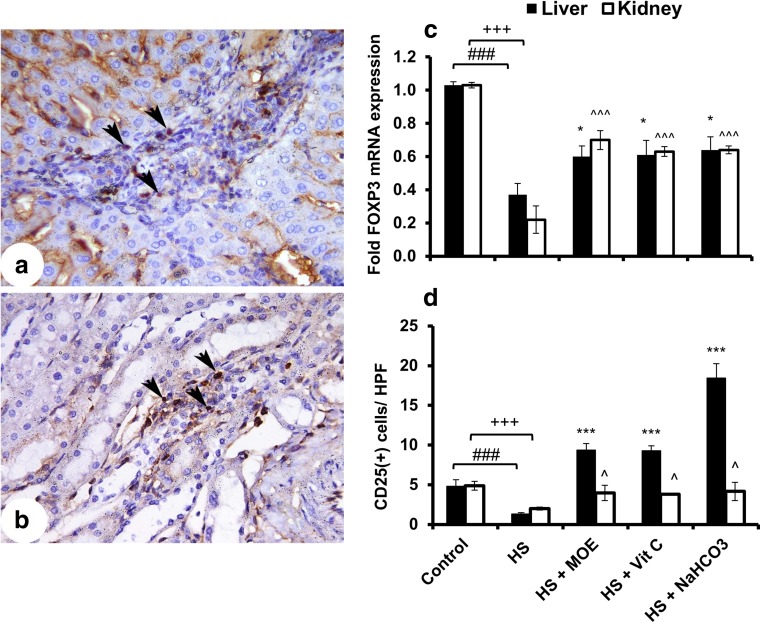
Fig. 3.
Effect of MOE, Vit C, and NaHCO3 on HS-induced infiltration of Treg cells in both of liver and kidney tissues. The figure shows mRNA expression (n = 9; mean ± SE) of FOXP3 (c) as well as the images of CD25+ cells in liver (a) and kidney (b) tissues. It shows also the mean count of stained cells ± SE/HPF (d). HS decreased (p < 0.001) the infiltration of Treg cells in both tissues in comparison to control, while treatments showed an increase in liver and kidney tissues versus HS group. The black arrow heads denote to the stained cells. # & + represent the degree of significance between liver and kidney HS, respectively, and control, while * & ^ represent the difference between treatments in the liver and kidney, respectively, with HS group

