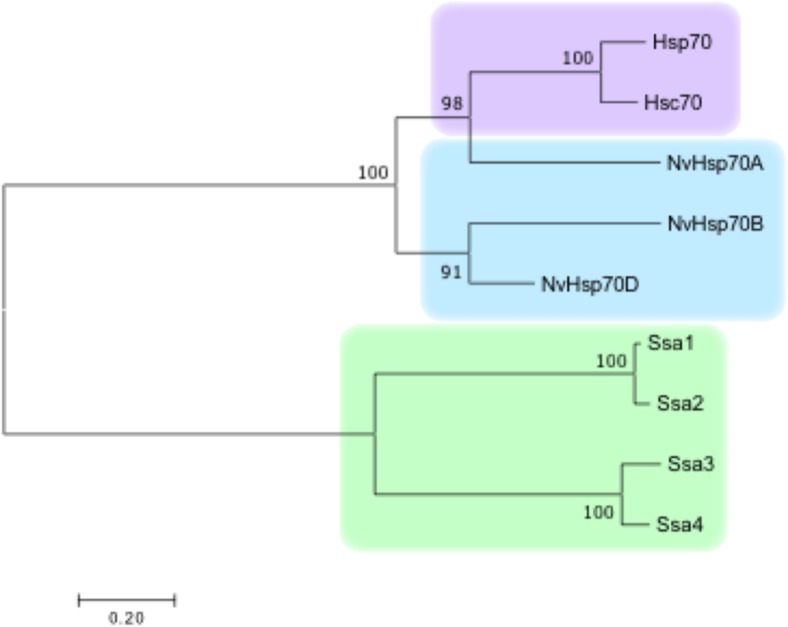
Fig. 2.
Phylogenetic comparison of Nematostella, yeast, and human Hsp70 isoforms. Sequences were aligned using Clustal Omega and used to produce a NJ tree with bootstrap using MEGA7. The numbers in the interior nodes represent percentage of replicate trees during the bootstrap test (1000 replicates) in which the associated taxa were clustered together. The branch lengths are proportional to inferred evolutionary distances. These lengths were computed using the Poisson correction method in the units of number of amino acid substitutions per site. Analysis involved a total of 639 positions in the final dataset

