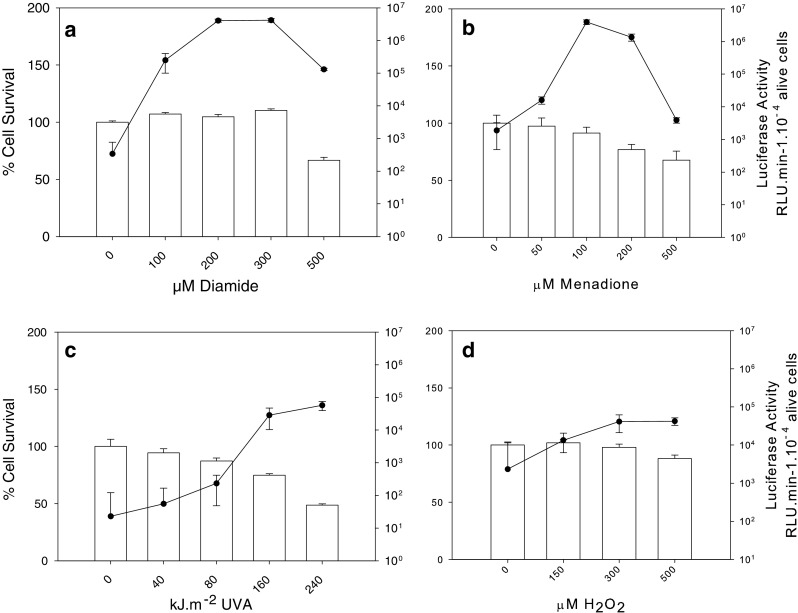
Fig. 2.

Relationship between the level of luciferase activity and cell survival following four types of oxidative stress. Each measurement was performed 5 h post-treatment. a Diamide (DA) was for 30 min, b menadione (MN) was for 12 min, c UVA irradiation (UVA) in the presence of photoactivable molecules was at various exposure times (fluency rate = 0.5 kJ m−2 s−1), d hydrogen peroxide (H2O2) was for 30 min. The results shown are the mean ± SD of at least three independent experiments. In each panel, histograms referred to percentage of survival (left y-axis) and the black dots/line to luciferase activity (right y-axis)
