Fig. 7.
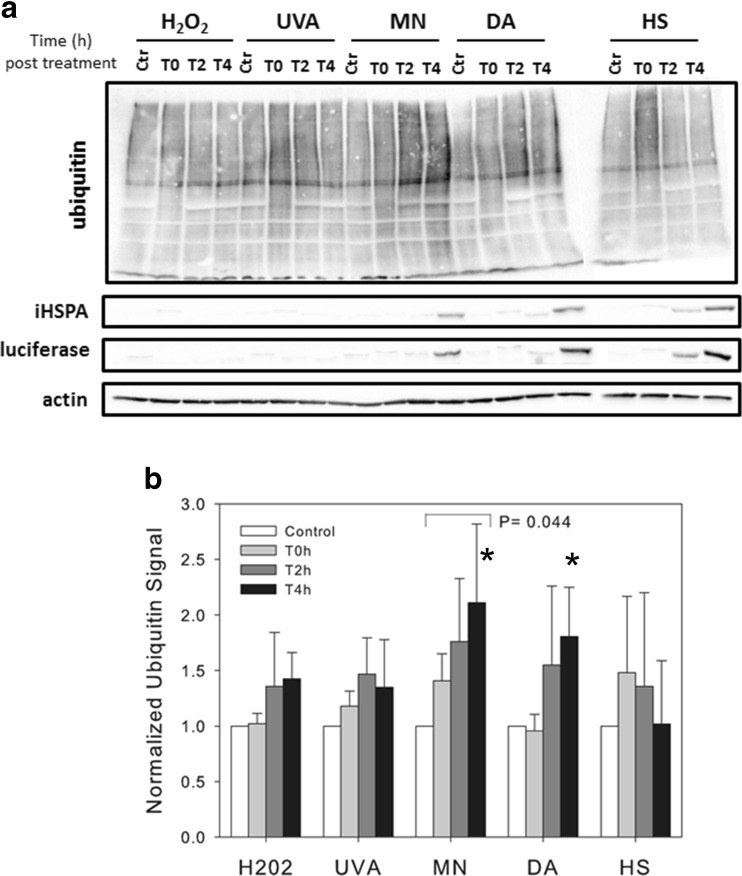
Comparison of the changes in protein ubiquitination profiles following the four types of oxidative stress and heat stress. Bovine cells were exposed to the different treatments as described in Fig. 3, and the total level of protein ubiquitination was detected by western blot at various time points post-treatment. a Shown is a representative image of the western blot analyses. iHSPA/HSP70 and luciferase expression were also detected by western blot. Actin was used as a loading control. b Quantification of the level of protein ubiquination after the different treatments. ImageJ was used for the quantification. The results shown are the mean ± SD of four independent experiments. Their statistical analysis showed that the weak effect of group treatment (P = 0.08) was mainly due to MN treatment (P = 0.044) compared to the control (bracket). An ANOVA for T4 values only using a non-parametric Kruskal-Wallis test indicated a significant difference between treatments (P = 0.0304), and the post hoc analysis with Bonferroni correction showed that this effect was mainly due to two significant treatments: MN and DA (P = 0.018 and 0.025, respectively) indicated by stars

