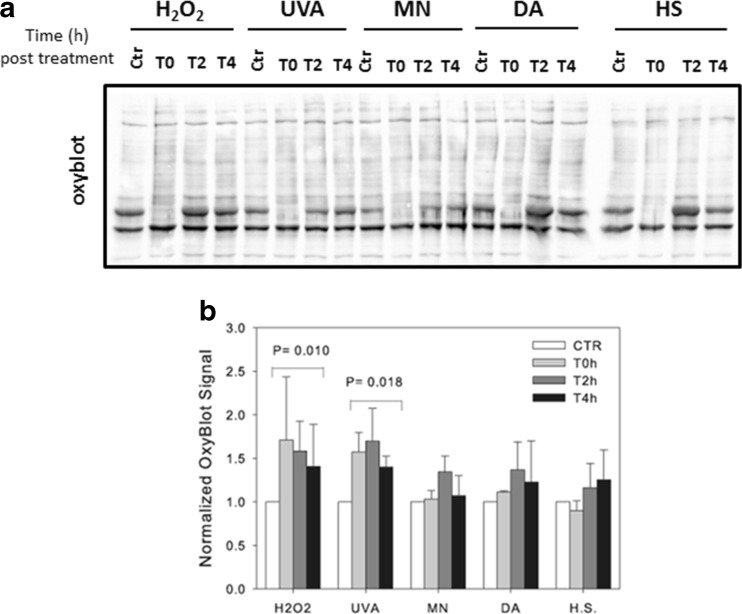
Fig. 8.
Comparison of the changes in protein carbonylation profiles following the four types of oxidative stress and heat stress. Bovine cells were exposed to the different treatments as described in Fig. 3, and the total level of protein carbonylation was detected by western blot at various time points post-treatment. a Shown is an example of protein carbonylation after DNPH derivatization of the same protein extracts analyzed in Fig. 7. b Quantification of the level of protein carbonylation after the different treatments. ImageJ was used for the quantification. The results are the mean ± SD of four independent experiments. Their statistical analysis showed that the significant effect of group treatment (P = 0.022) was mainly due to H2O2 and UVA treatments (P = 0.010 and P = 0.018 respectively) compared to the control

