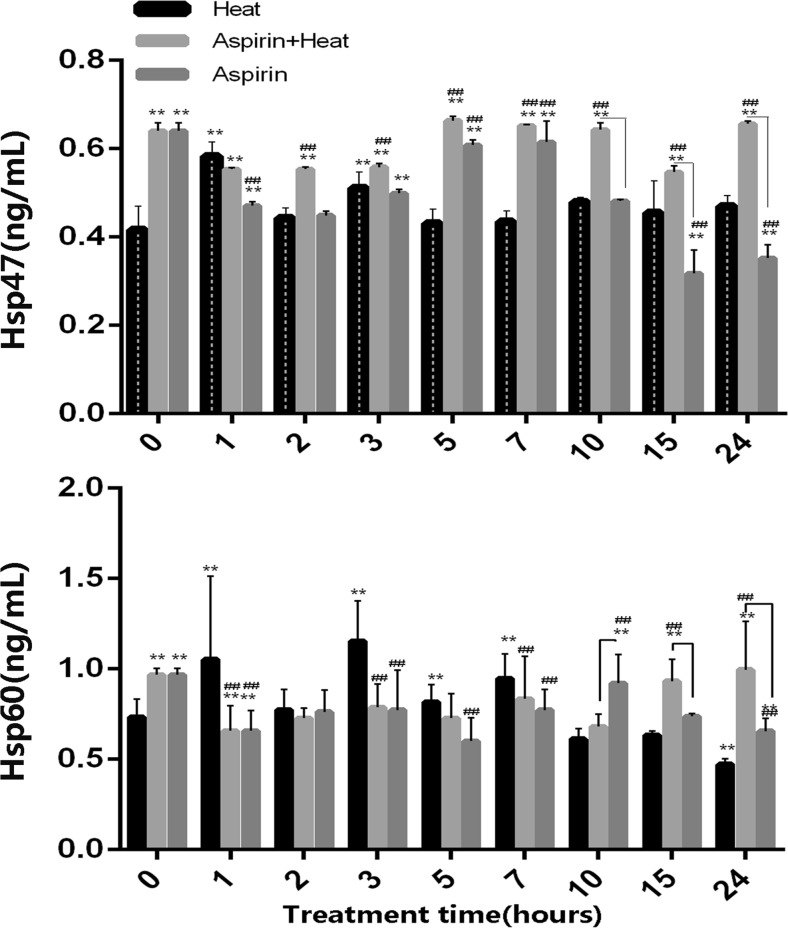
Fig. 4.
Hsp47 and Hsp60 expression profiles in the different treatment groups. a Hsp47 was significantly expressed after aspirin pretreatment, and remained at a higher level than in the Heat group until 24 h of heat stress (##p < 0.01 for Aspirin + Heat vs. Heat group). In the heat stress groups, Hsp47 expression increased at 1 and 3 h (**p < 0.01 for 0-h heat stress vs. heat stress for different times). The other time points showed similar expression levels to the no heat stress group. The aspirin treatment group showed higher values at 5−7 h, which then decreased until 24 h (##p < 0.01). Lines indicate significant differences between the Aspirin + Heat and Aspirin groups. b Hsp60 expression was pre-induced slightly before heat stress, after which it showed a decreasing trend from 1 to 10 h of heat stress in the treatment groups, and an increasing trend from 15 to 24 h (##p < 0.01 vs. the heat stress group). In the heat stress group, Hsp60 expression was increased from 1 to 7 h, after which it decreased from 10 to 24 h of heat stress (**p < 0.01). The aspirin group showed a decreasing trend in Hsp60 expression from 1 to 24 h (##p < 0.01). Lines indicate significant differences between the Aspirin + Heat and Aspirin groups

