
Figure 2.
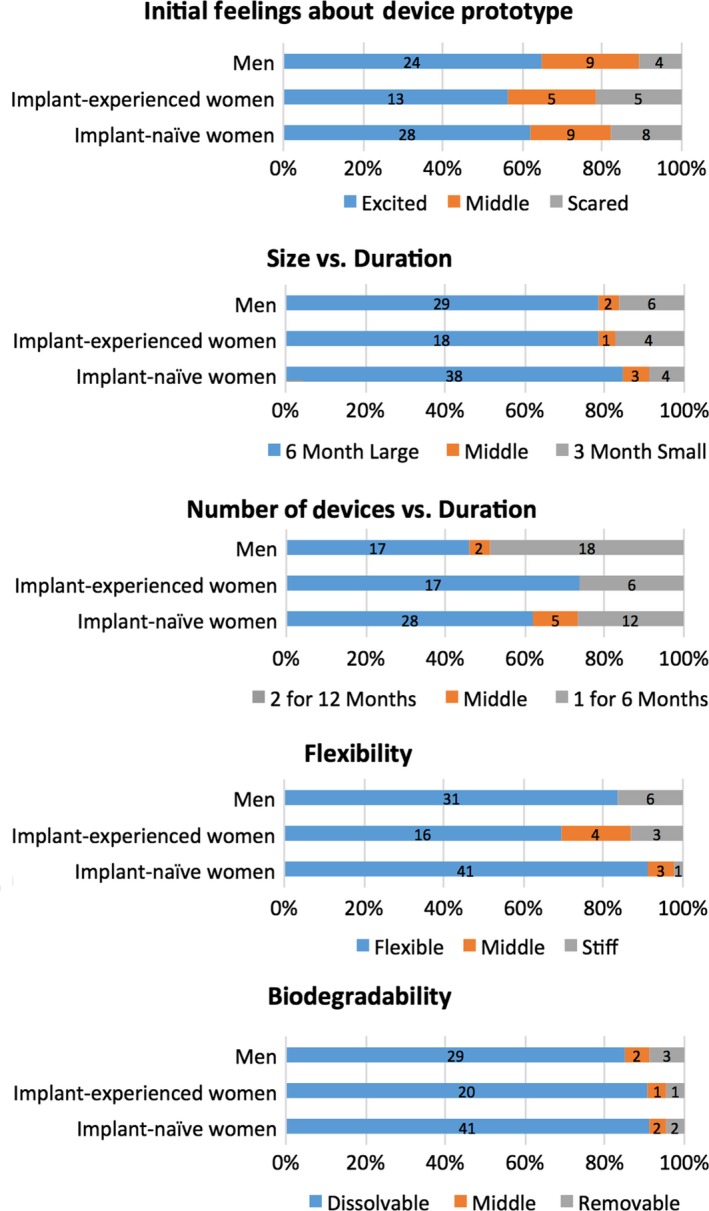
PrEP implant attribute preferences from FGD voting statement activity, stratified by FGD group category (N = 105 total participants). Reflects individual voting responses from all participants when asked to indicate their preferences for product attributes by placing a sticker along a continuum with two extremes representing differing attribute levels. Although participants were allowed to place stickers anywhere along a continuum for the voting statement activity, we used a quantitative approach to analyze results by assigning votes to one of three categories: (1) preferred attribute on the left end of continuum, (2) preferred attribute on the right end of continuum, or (3) “middle” if participant placed the sticker in between the two extremes, indicating either that the participant preferred a compromise or middle level of given attributes, was undecided, or preferred none of the options given. Numbers on bars indicate n = number of participants who gave that response.