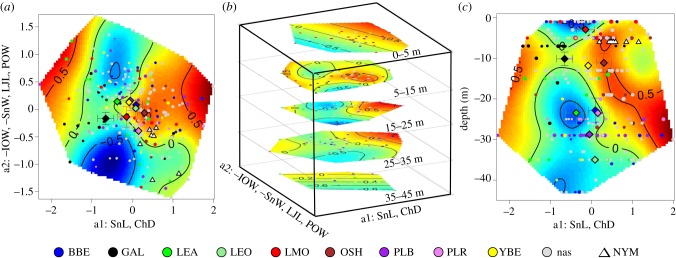
Figure 3.
Fitness surfaces visualizing (a) the projections from the PPR, showing evidence of two local fitness optima along a1, (b) the differences in the fitness surface at different depths (in 10 m depth intervals), and (c) the change of the fitness surface along the smoothed depth gradient. In the depth range between 5 and 35 m, two fitness optima exist. The position of Astatotilapia from the Pangani Reservoir (=NYM; triangles) indicates that the ancestral Chala phenotype was near the optimum with positive a1 values. The two optima converge at about 10 m depth. At this depth, GAL (black) occupies the otherwise sparsely occupied, derived optimum at negative a1. Dots represent individuals from Lake Chala and diamonds represent morph means with standard errors. The size of the dots represents individual raw growth rate estimates; surface colour reflects smoothed overall fitness estimates. Fish from NYM were not used for the inference of the fitness landscape, but were projected into the phenotype space afterwards. (Online version in colour.)

