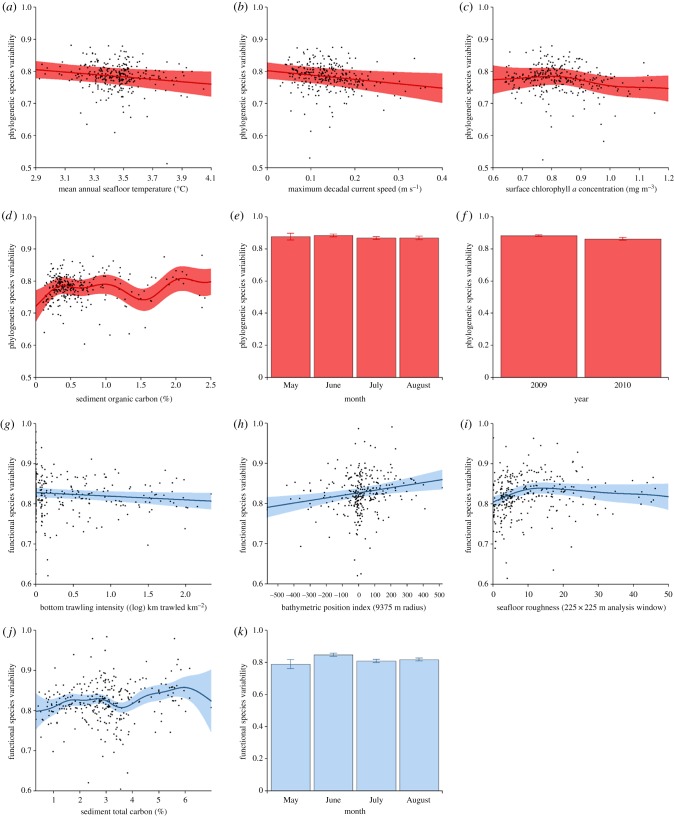
Figure 4.
Relationships between the phylogenetic (red)/functional variability (blue) of sampled peracarid assemblages (n = 299) and environmental parameters. (a) PSV/mean annual seafloor temperature, (b) PSV/maximal decadal current speed, (c) PSV/surface chlorophyll a concentration, (d) PSV/sediment organic carbon content, (e) PSV/month, (f) PSV/year, (g) FSV/bottom trawling intensity, (h) FSV/BPI, (i) FSV/seafloor roughness, (j) FSV/sediment total carbon content, (k) FSV/month. Error around best-fit lines/bar values = 95% confidence intervals. (Online version in colour.)

