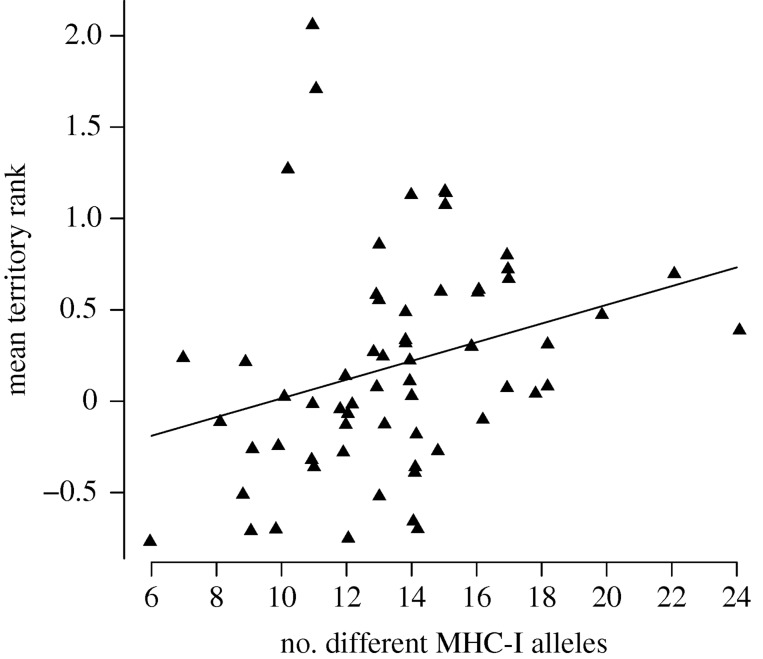
Figure 3.
The relationship between the mean territory rank and MHC-I diversity (i.e. the number of different MHC-I alleles per individual) in males with predicted values from a linear regression model (see the text for model details). The relationship is illustrated using the lifetime mean of age-standardized territory attractiveness rank values (see electronic supplementary information). Note: jitter was added to the number of different MHC-I alleles to distinguish individual data points.

