Figure 2.
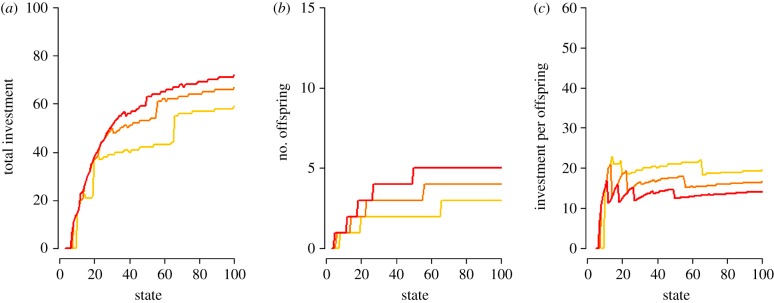
Scenario 1A (figure 1). Plots showing results from the stochastic dynamic optimization. In each plot, the different optimal investments along the axis of female energetic state (x-axis). Yellow lines correspond to low-quality males, orange medium-quality and red high-quality males. (a) Total investments given maternal energetic state. (b) Number of offspring given maternal energetic state. (c) Investment per offspring given maternal energetic state. Lines in (a) are products of the lines in (b) and (c). (Online version in colour.)

