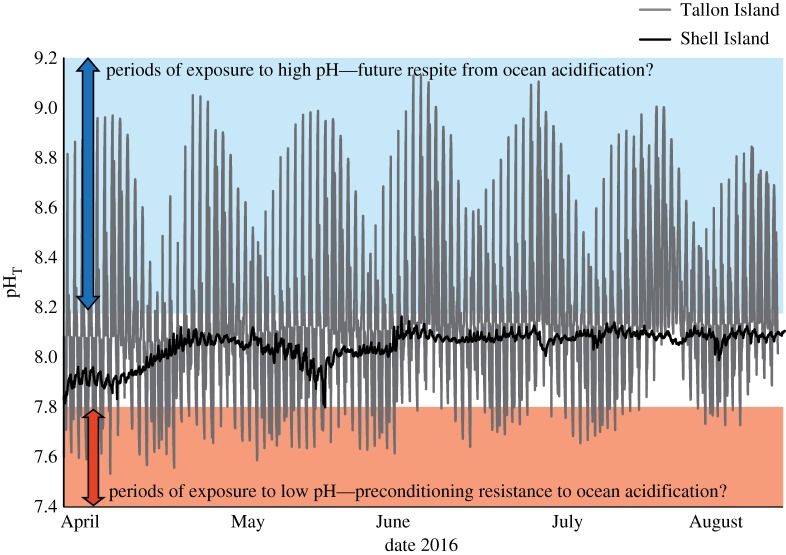
Figure 2.
Example of pH variability measured at the collection sites. Tallon Island (in grey) being a coralline algal platform and Shell Island (in black) being a large coral-dominated intertidal pool. Note that early April corresponds to the coral bleaching even described in Le Nohaïc et al. [37]. Blue denotes pH range above those encountered at Shell Island, and red indicates those encountered below those at Shell Island. (Online version in colour.)

