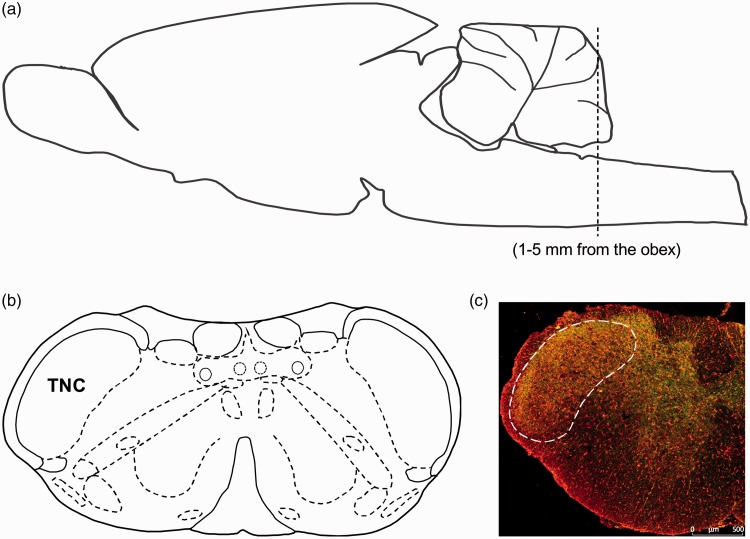
Figure 1.
Schematic representation of the brain region for TNC. (a) Side view of the rat brain to show the region of the TNC for analysis. The brain region for TNC was analyzed along the brainstem at approximately 1 to 5 mm from the obex. (b) The coronal view shows the location of TNC in the rat brain. (c) Immunofluorescence staining of coronal section representing the brain region for TNC (Scale bar = 500 μm). (a) and (b) are adapted from George Paxinos and Charles Watson.30

