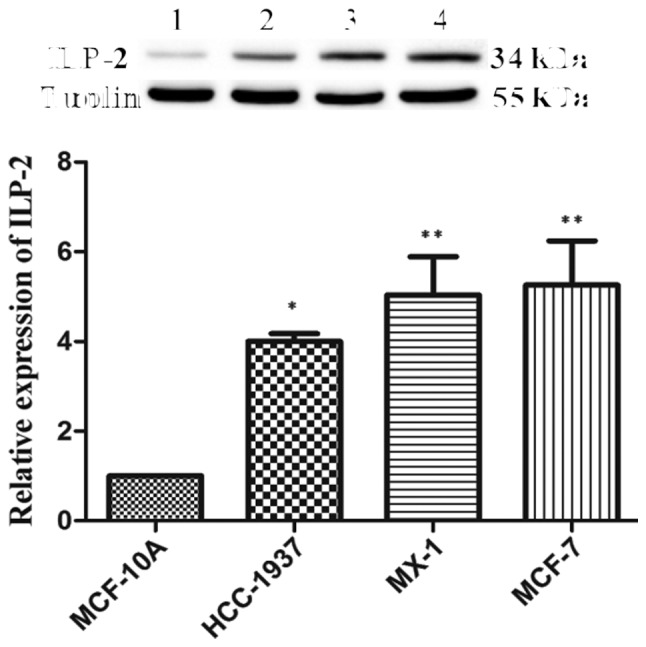
Figure 2.

Western blot analysis indicating ILP-2 protein expression in MCF-10A, HCC-1937, MX-1 and MCF-7 cell lines. The results showed that ILP-2 expression in the HCC-1937, MX-1 and MCF-7 cell lines was significantly increased when compared to that of the MCF-10A cells. Lanes 1, 2, 3 and 4 separately indicate the protein expression level in the MCF-10A, HCC-1937, MX-1 and MCF-7 cell lines. *P<0.05, **P<0.01 vs. the MCF-10A cells. Data are expressed as mean ± SEM by ANOVA. Groups were compared by conducting Bonferroni test; n=3.
