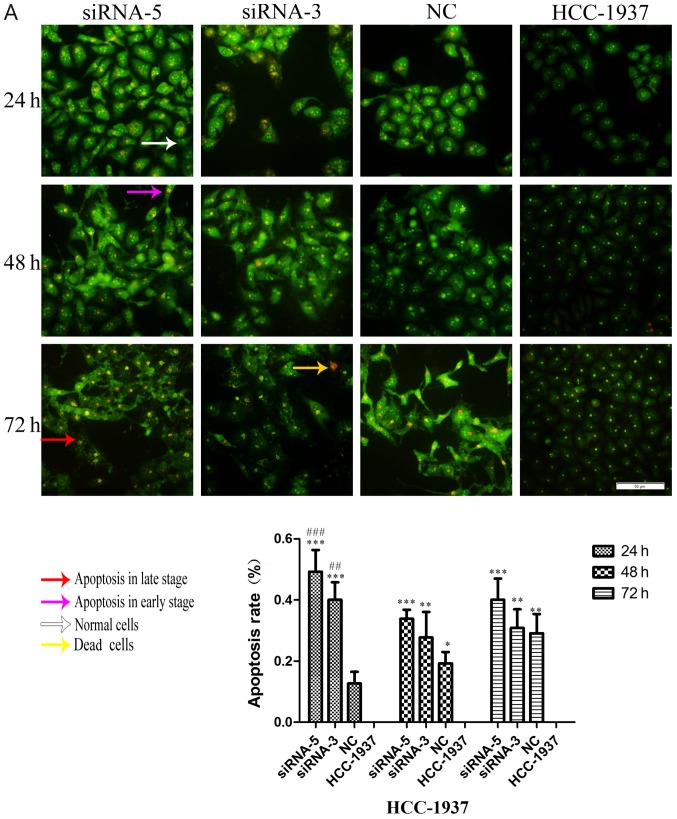
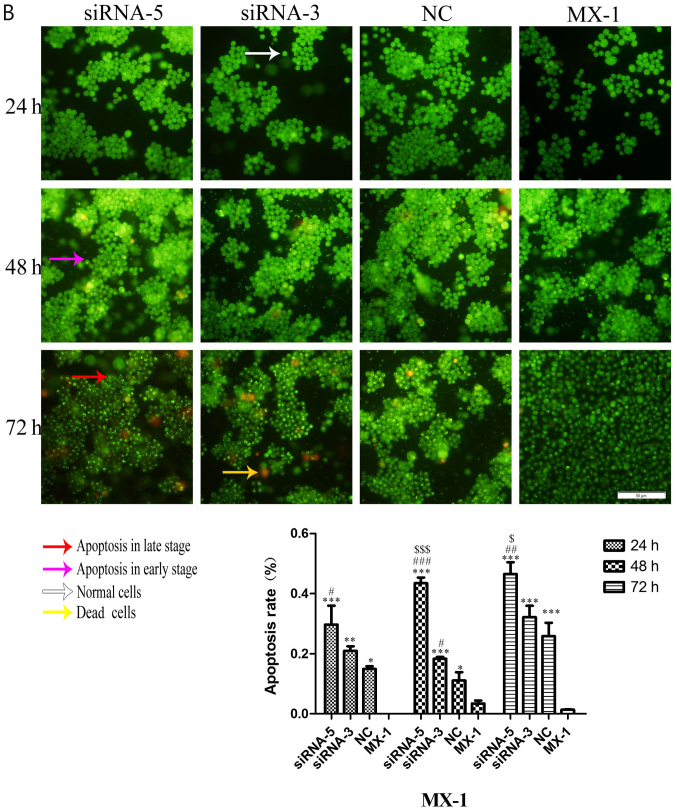
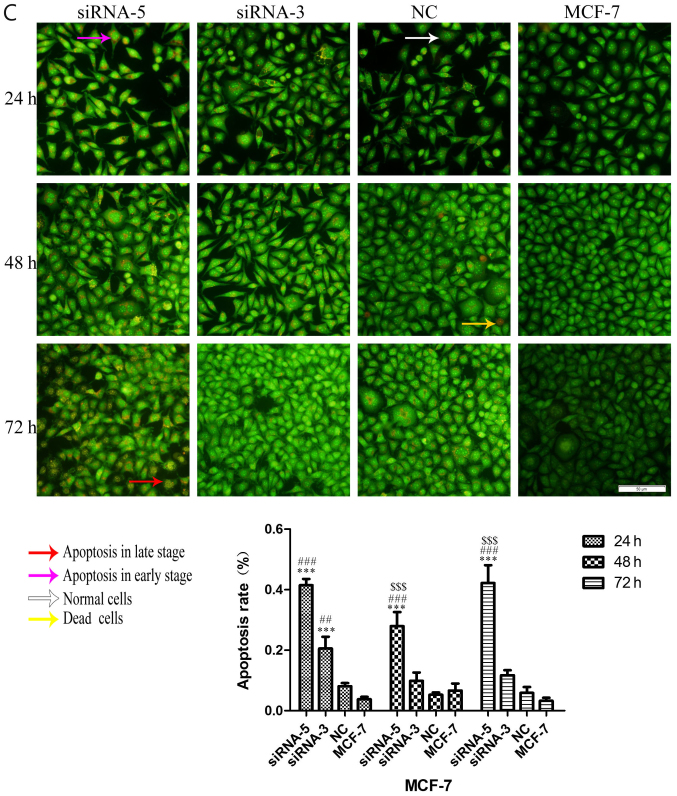
Figure 7.
AO-EB double staining analysis showing the apoptotic rate of HCC-1937, MX-1 and MCF-7 cell lines when ILP-2 was separately knocked down for 24, 48 and 72 h. (A) In regards to the HCC-1937 cell line, the apoptosis rate of the siRNA-5 group was notably increased when compared to the HCC-1937 group. *P<0.05, **P<0.01, ***P<0.001 vs. the HCC-1937 group; ##P<0.01, ###P<0.001 vs. the NC group. (B) In regards to the MX-1 cell line, the apoptotic rate of the siRNA-5group was notably increased when compared to the MX-1 group. *P<0.05, **P<0.01, ***P<0.001 vs. the MX-1 group; #P<0.05, ##P<0.01, ###P<0.001 vs. the NC group; $P<0.05, $$$P<0.001 vs. the siRNA-3 group. (C) In regards to the MCF-7 cell line, the apoptotic rate of the siRNA-5 group was notably increased when compared to the MCF-7 group. ***P<0.001 vs. the MCF-7 group; ##P<0.01, ###P<0.001 vs. the NC group; $$$P<0.001 vs. the siRNA-3 group. Data are expressed as mean ± SEM by ANOVA. Groups were compared by conducting Bonferroni test. Scale bar, 100 µm; n=5.


