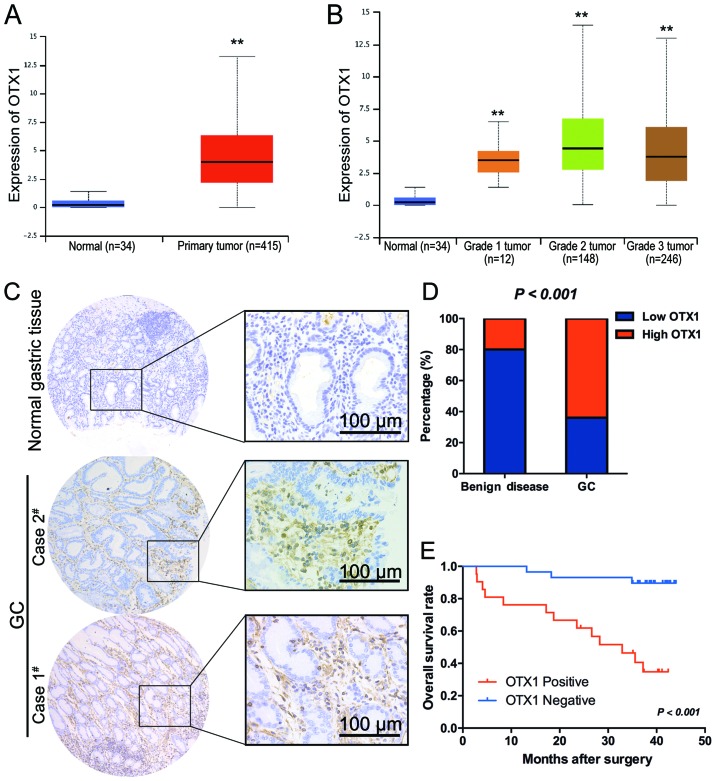
Figure 1.
OTX1 is highly expressed in gastric tumor samples. (A) Boxplot showing the relative expression of OTX1 in normal and GC samples; **P<0.01. (B) Boxplot showing the relative expression of OTX1 in normal, grade I, grade II and grade III GC patients; **P<0.01. (C) Representative image of GC staining using an anti-OTX1 antibody. (Case #2) Moderate expression of OTX1 in GC tissues; (Case #1) strong expression of OTX1 in poorly differentiated GC tissues (scale bar, 100 µm). (D) The bar graph revealing the statistical results for the staining intensity in GC tissues and benign-diseased tissues. (E) Kaplan-Meier curve for the OS of GC patients was correlated with OTX1 expression. OS, overall survival.

