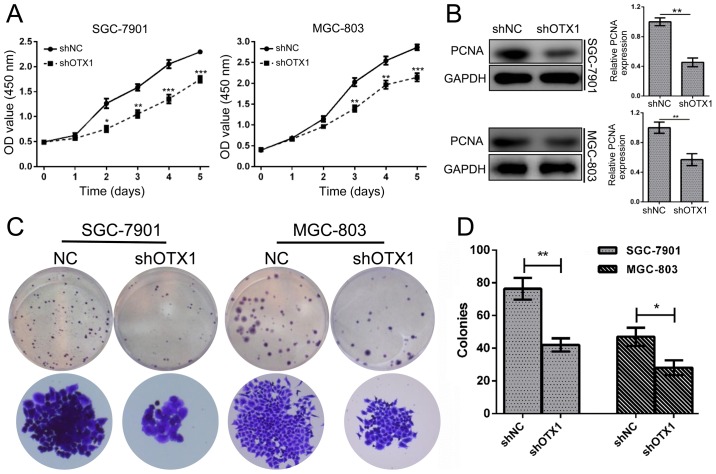
Figure 3.
OTX1 knockdown inhibits the growth of GC cells. (A) The proliferation rates of SGC-7901 and MGC-803 cells were determined using CCK-8 assays following transfection with shOTX1 and shNC lentiviral vectors. (B) Western blot analysis of PCNA expression in SGC-7901 and MGC-803 cells following OTX1 knockdown (left). Ratio of PCNA to GAPDH determined by band density, presented as the mean ± SD, compared with shNC (designated as 1.00) (right). (C) Colony-forming ability was examined following the knockdown of OTX1 in GC cells. Representative images of the crystal violet staining of colonies are displayed. (D) The number of colonies was counted and statistically analyzed. The data are expressed as the mean ± SD for three independent experiments. *P<0.05; **P<0.01; ***P<0.001 compared with the negative control group (shNC).

