Figure 6.
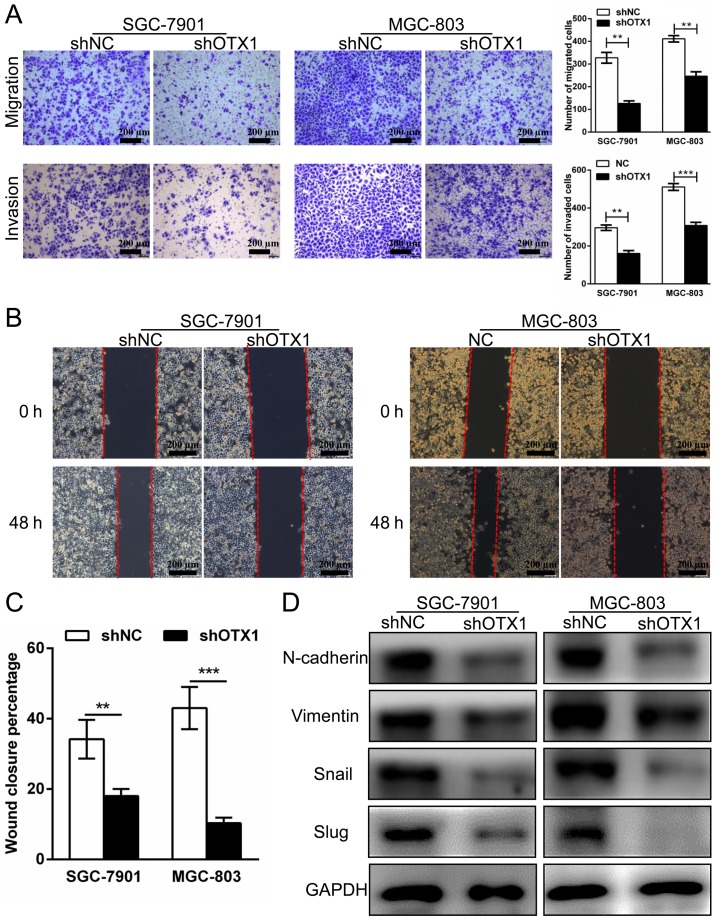
Knockdown of OTX1 attenuates GC cell migration and invasion. (A) Migration (upper panel) and invasion (bottom panel) assays for shNC-transfected and shOTX1-transfected GC cells. Scale bars, 100 µm. Quantitative results for the migrated and invaded GC cells (right panel) are shown. Three independent experiments were conducted, and the results are presented as the mean ± SD. **P<0.01, ***P<0.001. (B) A wound healing assay was performed to determine the migration of SGC-7901 and MGC-803 cells following infection with an shNC- or shOTX1-expressing virus. (C) Quantitative analysis of the percentage of wound closure. **P<0.01, ***P<0.001. (D) Western blot analysis of the levels of EMT marker proteins in SGC-7901 and MGC-803 cells following infection with shNC- and shOTX1-expressing viral vectors. GAPDH served as an internal control.

