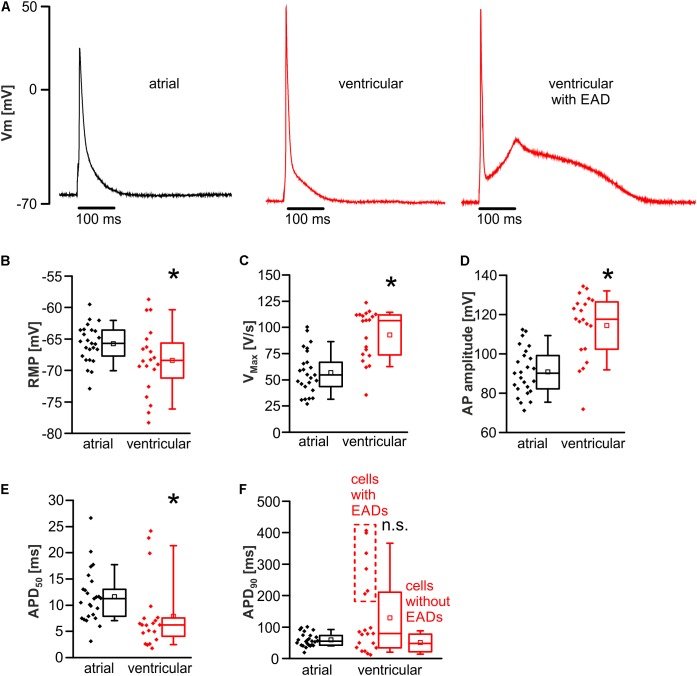
FIGURE 2.
Distinct action potential kinetics in atrial versus ventricular myocytes. (A) Representative action potentials in atrial (left) and ventricular cardiomyocytes without (mid) and with (right) an EAD. Atrial myocytes exhibited a depolarized resting membrane potential (RMP) (B), a decreased maximal action potential (AP) upstroke velocity (Vmax) (C), a decreased AP amplitude (D), and prolonged action potential duration to 50% decay (APD50) (E). (F) Though a fraction of ventricular cells exhibited incessant EADs leading to AP prolongation (raw values within the dashed box), the average APD90 was unaltered between both cell types. ∗p < 0.05 atrial vs. ventricular; n.s., non-significant.

