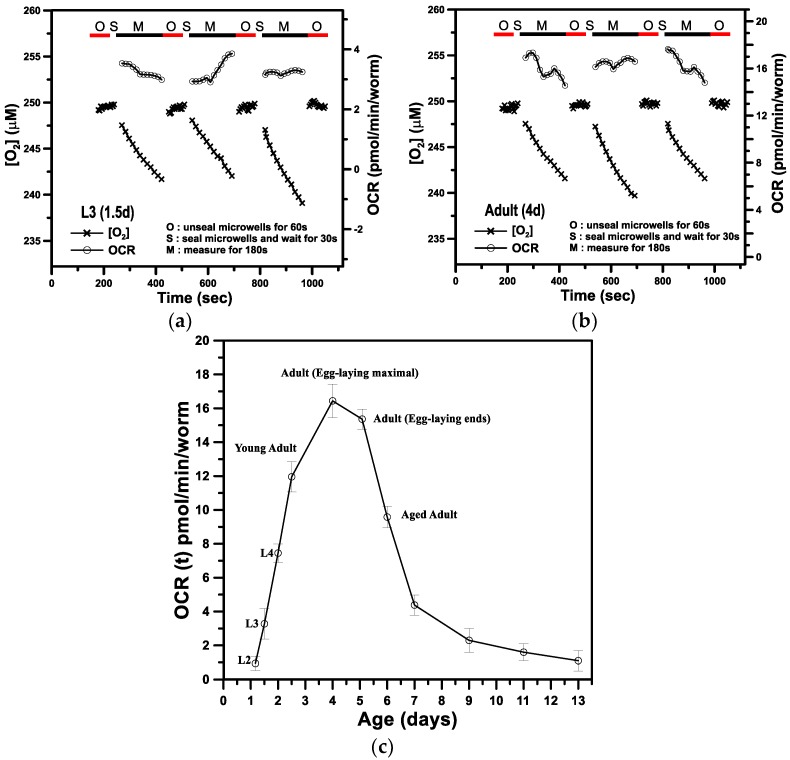
Figure 5.
(a) The time variation in the aqueous O2 concentration ([O2], μM) and OCR (−d[O2]/dt) for a single C. elegans at (a) L3 (1.5 days) and (b) adult (4 days). (c) The basal OCR of a single C. elegans inside a sealed microwell from the stages of postembryonic development (L2, L3, and L4) through adulthood to aged adult stages. (Mean ± SEM; n = 5).

