
Figure 1.
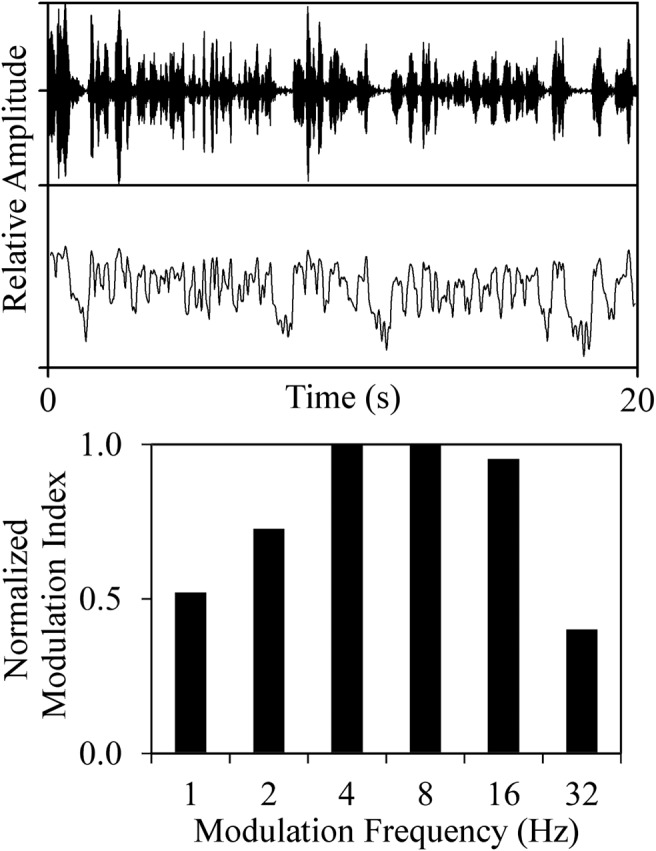
Example EMS plot for a typical speaker. The top waveform depicts the raw audio file, the middle portion depicts the extracted amplitude envelope, and the bottom portion displays the modulation index for each modulation band. EMS = envelope modulation spectrum.