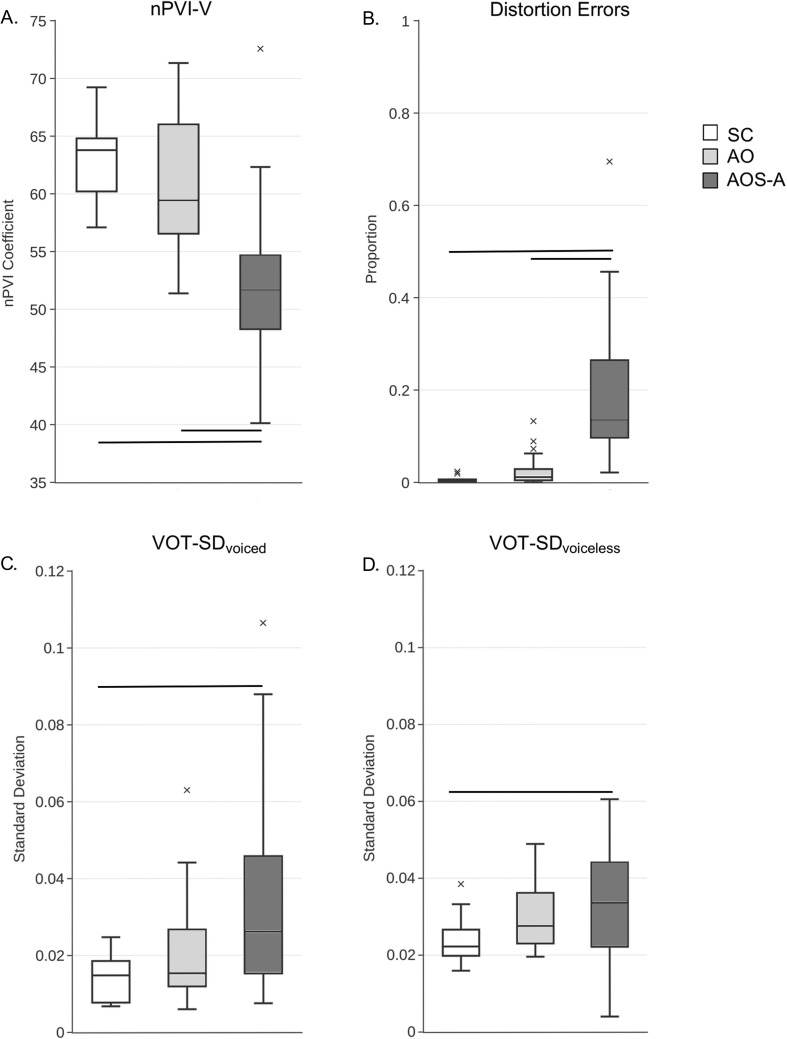
Figure 2.
Box plots of the proportion of nPVI-V (Panel A), distortion errors (Panel B), and VOT variability for voiced (Panel C) and voiceless (Panel D) initial stop consonants. Horizontal lines indicate group differences at Bonferroni-corrected p level of .0167. Outliers are indicated by the x. SC = Stroke Control; AO = Aphasia Only; AOS-A = Apraxia of Speech with Concomitant Aphasia; nPVI-V = normalized Pairwise Variability Index–Vowels; VOT-SD = standard deviation of voice onset time.

