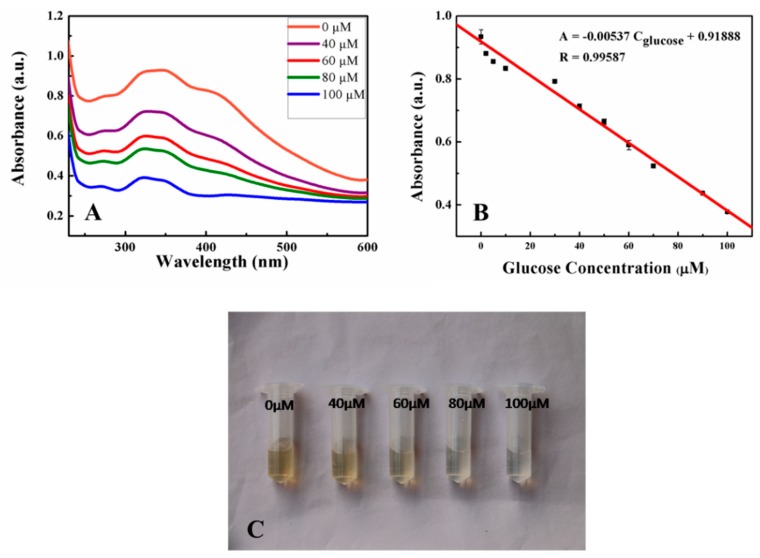
Figure 4.
UV-vis spectra of the detection of different concentrations (0, 5, 50, and 100 μM) of glucose (A), the linear relationship between the absorbance at 346 nm and glucose concentrations (B), and the visual detection of variable glucose (C). Error bars in (B) represented the SDs from three independent detections.

