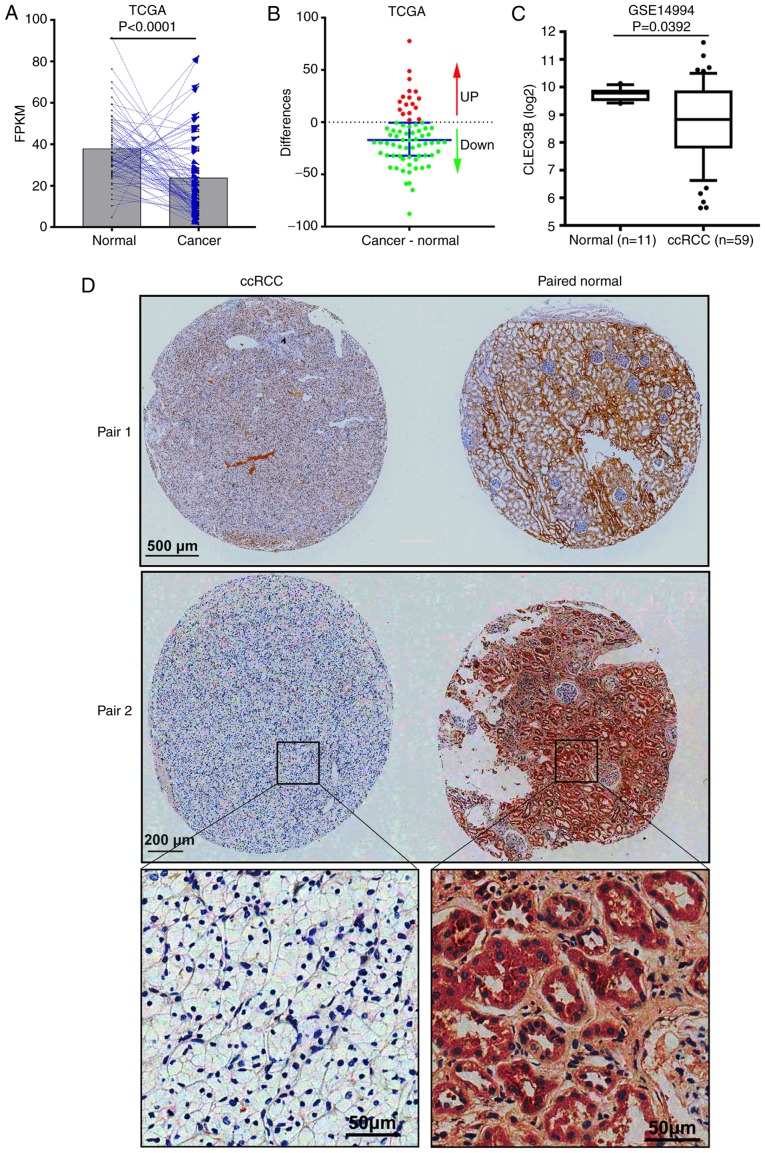
Figure 1.
CLEC3B is downregulated in ccRCC. (A) CLEC3B mRNA is significantly downregulated in ccRCC compared with matched adjacent normal from the TCGA kidney renal clear cell carcinoma dataset (P<0.0001). (B) Differences in CLEC3B expression between cancer and normal tissues in the aforementioned 72 patients. The dots represent the difference value of cancer CLEC3B subtracted by normal CLEC3B for every patient. The red dots represent a positive difference value, indicating that CLEC3B is upregulated in cancer; while the green dots represent a negative difference value, indicating that CLEC3B is downregulated in cancer. The bar represents the median with the interquartile range. (C) Validation of CLEC3B mRNA downregulation in a Gene Expression Omnibus dataset (GSE14994). (D) Representative images for the paired samples from two patients with ccRCC, demonstrating that CLEC3B was also downregulated in ccRCC tissue compared with normal tissue at the protein level. TCGA, The Cancer Genome Atlas; ccRCC, clear cell renal cell carcinoma; FPKM, Fragments Per Kilobase of transcript per Million; CLEC3B, C-Type Lectin Domain Family 3 Member B.

