Table III.
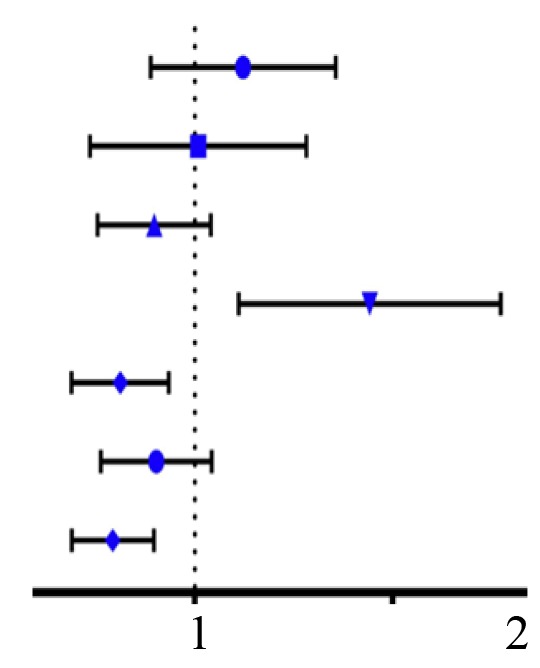
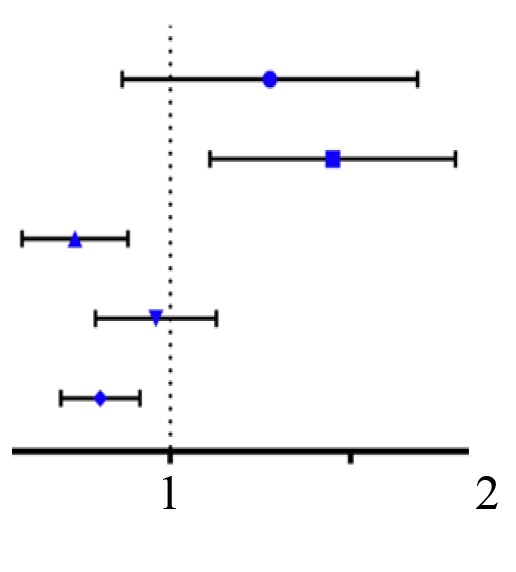
Univariate and multivariate Cox regression analyses of DFS rate in patients with clear cell renal cell carcinoma from The Cancer Genome Atlas dataset.
| Univariate Cox regression | ||||
|---|---|---|---|---|
| Variables | Classification | DFS [hazard ratio (95% CI)] | P-value | |
| Sex | Female vs. male |  |
1.186 (0.809,1.739) | 0.382 |
| M | M0 vs. M1 | 0.920 (0.527,1.606) | 0.770 | |
| Age | ≤60 vs. >60 | 0.761 (0.528,1.096) | 0.142 | |
| T | T1-T2 vs. T3-T4 | 1.807 (1.265,2.581) | 0.001 | |
| Stage | Stage I–II vs. Stage III–IV | 0.591 (0.395,0.884) | 0.010 | |
| Grade | G1-G2 vs. G3-G4 | 0.773 (0.543,1.101) | 0.154 | |
| CLEC3B | Low vs. High | 0.562 (0.392,0.805) | 0.002 | |
| Multivariate Cox regression | ||||
| DFS [hazard ratio (95% CI)] | P-value | |||
| Sex | Female vs. male | |||
| M | M0 vs. M1 |  |
||
| Age | ≤60 vs. >60 | 1.411 (0.815,2.433) | 0.218 | |
| T | T1-T2 vs. T3-T4 | 1.820 (1.265,2.618) | 0.001 | |
| Stage | Stage I–II vs. Stage III–IV | 0.405 (0.219,0.794) | 0.004 | |
| Grade | G1-G2 vs. G3-G4 | 0.881 (0.608,1.275) | 0.500 | |
| CLEC3B | Low vs. High | 0.408 (0.587,0.845) | 0.004 | |
A Log-rank test was used for statistical analysis. CI, confidence interval; DFS, disease-free survival; T, size or direct extent of the primary tumor; M, presence of distant metastasis; CLEC3B, C-Type Lectin Domain Family 3 Member B.
