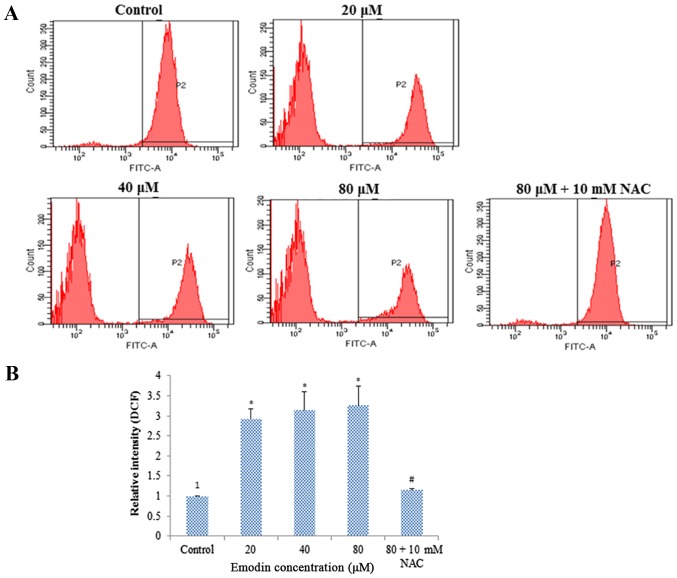
Figure 4.
ROS generation of HepaRG cells induced by various concentrations of emodin for 24 h, with or without NAC pretreatment. (A) Representative image of flow cytometry detection with DCFH-DA in HepaRG cells. (B) Column bar graph of the mean cell florescence for DCFH-DA. Data are expressed as the mean ± SD of three separate experiments (*P<0.05 vs. the control; #P<0.05 vs. the 80 µM emodin-treated group). ROS, reactive oxygen species; NAC, N-acetylcysteine.

