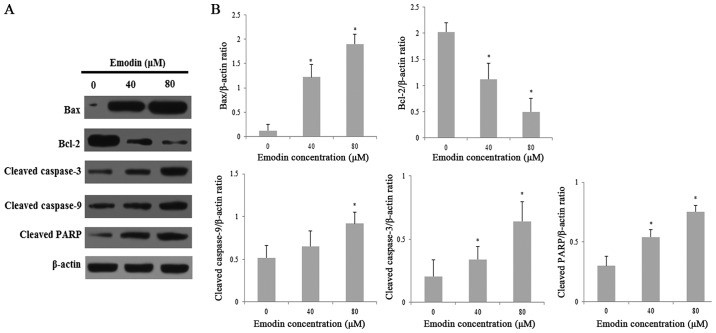
Figure 7.
The levels apoptosis-related proteins in the HepaRG cells induced by various concentrations of emodin for 24 h. (A) Expression of apoptosis-related proteins after treatment with emodin was determined. (B) The protein bands were quantified and statistically analyzed. Data for each image are expressed as the mean ± SD of three separate experiments (*P<0.05 vs. the vehicle control). Actin was used as an internal control.

