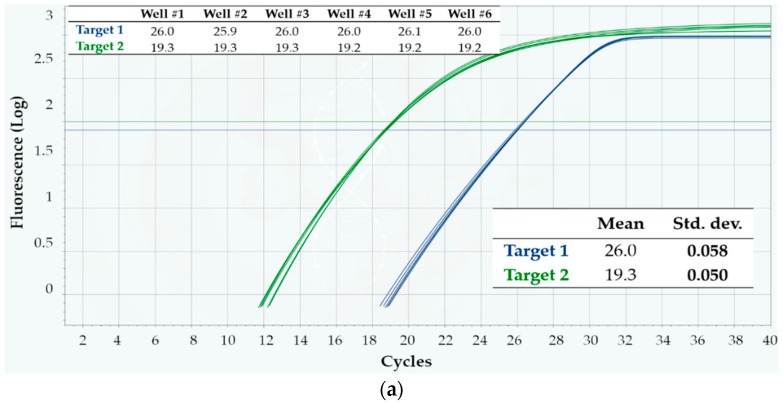
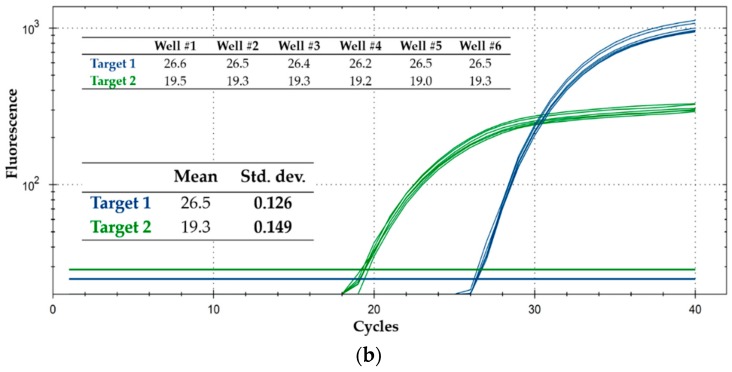
Figure 6.
Intra-run repeatability on the detection of two RNA targets, using Protocol 3. Shown are the fluorescence vs. cycle qPCR curves; blue curves refer to target 1, while green ones refer to target 2. The inset tables display the corresponding Cq values, as well as their mean and standard deviation (Std. dev.). (a) Q3-Plus V2 results from a cartridge; (b) CFX96 results from a run.


