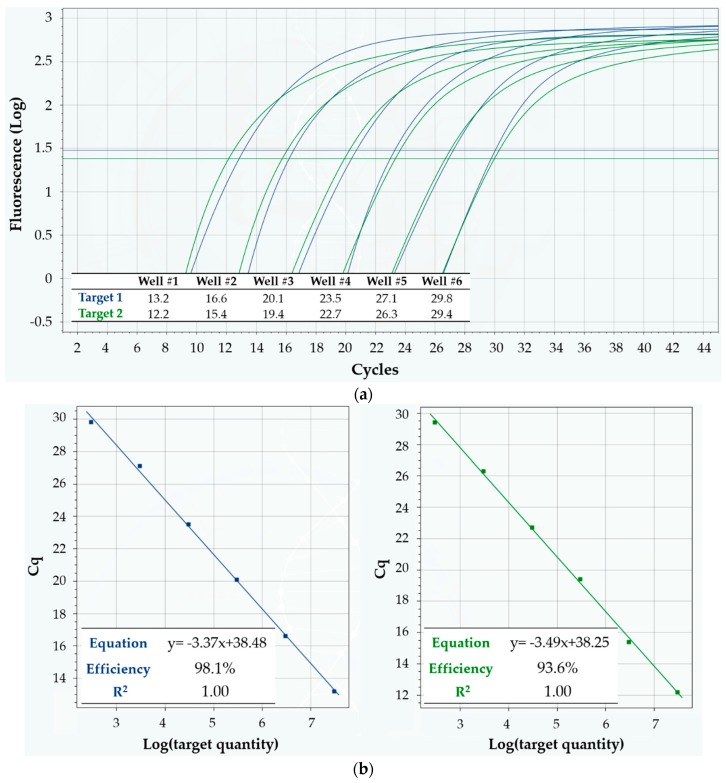
Figure 7.
Linearity of Q3-Plus V2 in multiplex detection of two DNA targets in a 10-fold dilution series, using Protocol 4. (a) Fluorescence vs. cycle qPCR curves. Blue curves refer to target 1, while green ones refer to target 2. The inset table displays the corresponding Cq values; (b) Standard curves for absolute quantification of target quantity. The inset tables show the equation of the linear fit, as well as its R2 value and the mean reaction efficiency for target 1 (left, in blue) and target 2 (right, in green).

