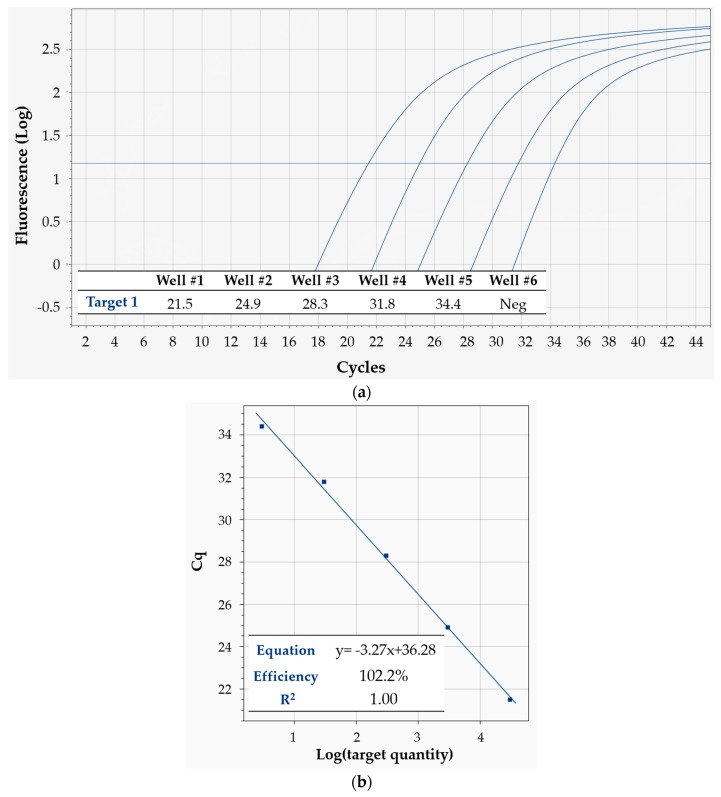
Figure 9.
Linearity and sensitivity of Q3-Plus V2 in detecting a DNA target in a 10-fold dilution series, using Protocol 6. (a) Fluorescence vs. cycle qPCR curves. The inset table displays the corresponding Cq values. The sixth well featured a no-template control—which yielded a negative result, as expected; (b) Standard curve for absolute quantification of target quantity. The inset table shows the equation of the linear fit, as well as its R2 value and the mean reaction efficiency.

