Figure 6.
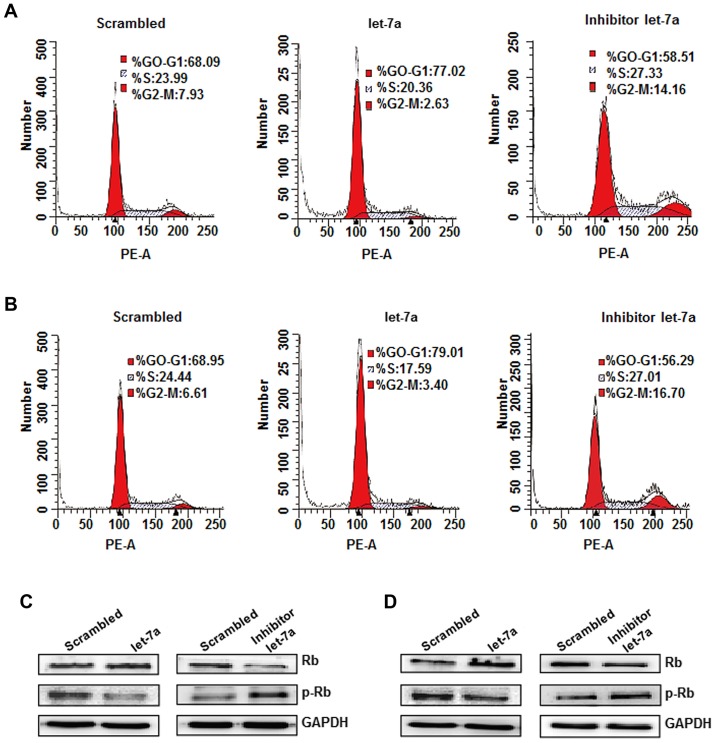
Let-7a inhibits cell cycle progression. (A) Representative cell cycle histograms show the percentage of A549 cells in each phase of the cell cycle after miR-negative control (scrambled), let-7a-mimics or let-7a-inhibitor transfection. (B) Let-7a resulted in cell cycle arrest at the G0/G1 in H1299 cells, compared to the control. (C) The expression of Rb and p-Rb proteins were analyzed by western blotting in A549 cells. (D) The expression of Rb and p-Rb proteins in H1299 cells. GAPDH was used as an internal control.

