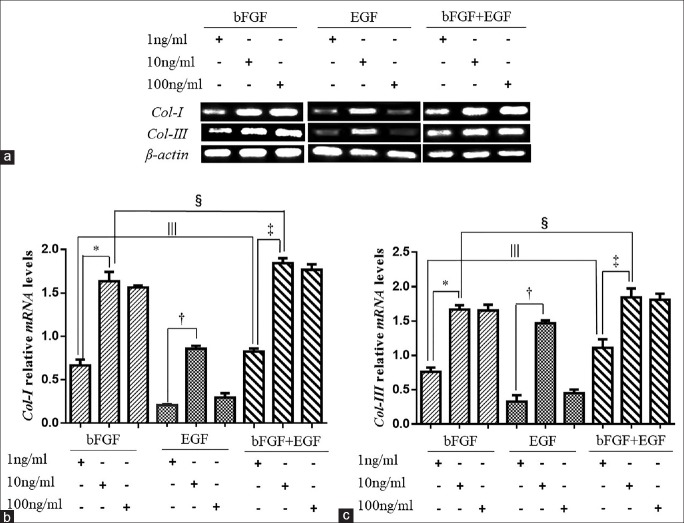
Figure 4.
Different mRNA expression levels of Type I and III collagens in fibroblasts induced from ADSCs in various concentrations of growth factors. (a) Fibroblasts were cultured in 6-well plates. Relative mRNA expression levels of Col-I and Col-III in the various groups of fibroblasts at the 7th day were measured by RT-qPCR. Values were calculated as a percentage of expression relative to β-actin. (b) Relative mRNA expression levels of Col-I of different concentration of growth factors. In the bFGF group, expression of Col-I of 10 ng/ml was highest (0.699 ± 0.074, 1.608 ± 0.114, and 1.500 ± 0.015, F = 79.13, *P = 0.0025). Among the EGF groups, the expression of Col-I in the 10 ng/ml group was more than other two concentrations (0.219 ± 0.018, 0.892 ± 0.022, and 0.350 ± 0.048, F = 245.50, †P = 0.0005). In the groups of two kinds of growth factors, the concentration of 10 ng/ml had the most effective promoting effect on the expression of Col-I (0.858 ± 0.023, 1.883 ± 0.099, and 1.840 ± 0.089, F = 110.50, ‡P = 0.0015). At the same concentration of 10 ng/ml, the expression of Col-I of bFGF mixed with EGF group was better than the other two groups (1.608 ± 0.114, 0.892 ± 0.022, and 1.883 ± 0.099; F = 67.45, §P = 0.0032). Even at the lowest concentration, 1 ng/ml, the group with two kinds of growth factors had better effect of improving the expression of Col-I than the single growth factor group (0.699 ± 0.074, 0.892 ± 0.022, and 0.858 ± 0.023, F = 104.90, ||P = 0.0017). (c) Relative mRNA expression levels of Col-III of different concentration of growth factors. In the bFGF group, the Col-III expression of concentration of 10 ng/ml was higher than that in the 1 ng/ml bFGF group (0.649 ± 0.048, 1.686 ± 0.045, and 1.612 ± 0.080, F = 187.20, *P = 0.0007) but was not different compared with the 100 ng/ml bFGF group. In the EGF groups, only the expression of Col-III in the 10 ng/ml group was highest (0.378 ± 0.093, 1.457 ± 0.023, and 0.490 ± 0.055, F = 173.1, †P = 0.0008). Col-III expression in the group of bFGF mixed with EGF was the highest at 10 ng/ml (1.104 ± 0.110, 1.894 ± 0.121, and 1.801 ± 0.098, F = 30.78, ‡P = 0.010). The Col-III expression at 1 ng/ml of two growth factors’ group was still higher than that in the 1 ng/ml bFGF and EGF alone groups (0.649 ± 0.048, 0.378 ± 0.093, and 1.104 ± 0.110, F = 35.05, §P = 0.0083). (c) At the 10 ng/ml, the group contained two growth factors made the fibroblasts expressed more Col-III (1.686 ± 0.045, 1.457 ± 0.023, and 1.894 ± 0.121, F = 16.67, ||P = 0.0237). ADSCs: Adipose mesenchymal stem cells; RT-qPCR: Reverse transcription quantitative real-time polymerase chain reaction; Col-I: Type I collagen; Col-III: Type III collagen; bFGF: Basic fibroblast growth factor; EGF: Epidermal growth factor.

