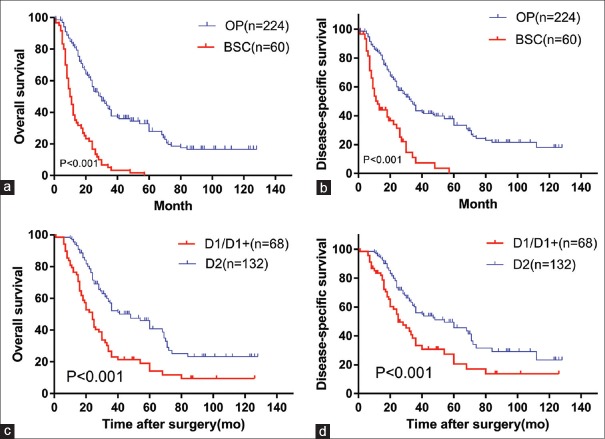
Figure 1.
Kaplan–Meier survival curve analyses for gastric cancer patients aged ≥75 years. (a) Overall survival curve and (b) disease-specific survival curve derived using the Kaplan–Meier method for OP and BSC (P < 0.001). (c) Overall survival curve and (d) disease-specific survival curve derived using the Kaplan–Meier method for the D1/D1+ and D2 groups (P < 0.001). BSC: Patients who received best supportive care except Stage IV or performance status 4; OP: Patients who underwent operation; mo: Months.

