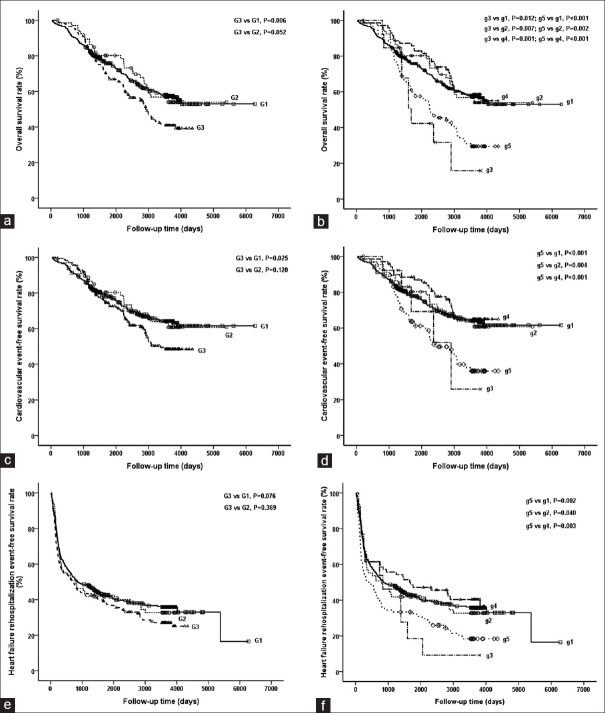
Figure 2.
Kaplan–Meier curves for overall survival rate (a and b), free survival rates of cardiovascular event (c and d), and HF re-hospitalization event (e and f) among different groups of acute HF patients, who were stratified by FPG levels. Non-DM, IFG, and DM groups corresponded to groups G1, G2, and G3 in Figure 2a, 2c and 2e; DM groups were further subdivided into three subgroups according to controlled FPG levels: FPG <3.9 mmol/L, 3.9 mmol/L≤ FPG <7.0 mmol/L and FPG ≥7.0 mmol/L corresponding to groups g3, g4 and g5; non-DM and IFG groups corresponded to groups g1 and g2 in Figure 2b, 2d and 2f. IFG: Impaired fasting glucose; DM: Diabetes mellitus; HF: Heart failure.

