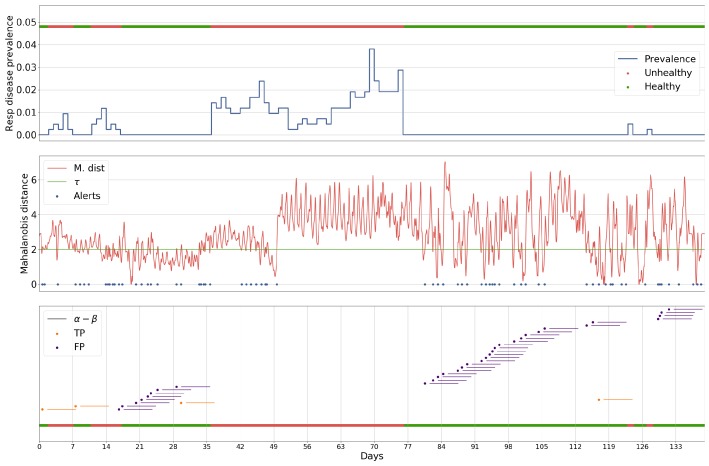
Figure 9.
Results for batch 27 processed by the GRU-autoencoder-powered anomaly detection, given its PSO-optimised parameters (the start of the window for which an alert is for), (the length of the window), and (the threshold which the loss between predicted values and actual values must cross to be considered an alert), in relation to the prevalence of respiratory disease within a single batch.

