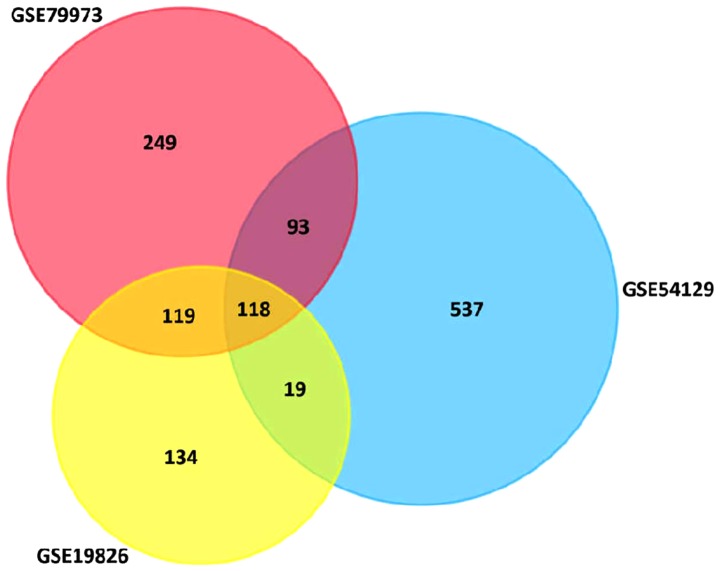
Figure 1.
Identification of DEGs and bioinformatic analysis. (A) Identification of 118 overlapped DEGs from the 3 cohort profile data sets (GSE79973, GSE19826 and GSE54129). Different color areas represent different datasets. DEGs were identified using a classical t-test and statistical significance defined by P<0.05 and [logFC]>2 as cut-off criterion. DEGs, differentially expressed genes.

