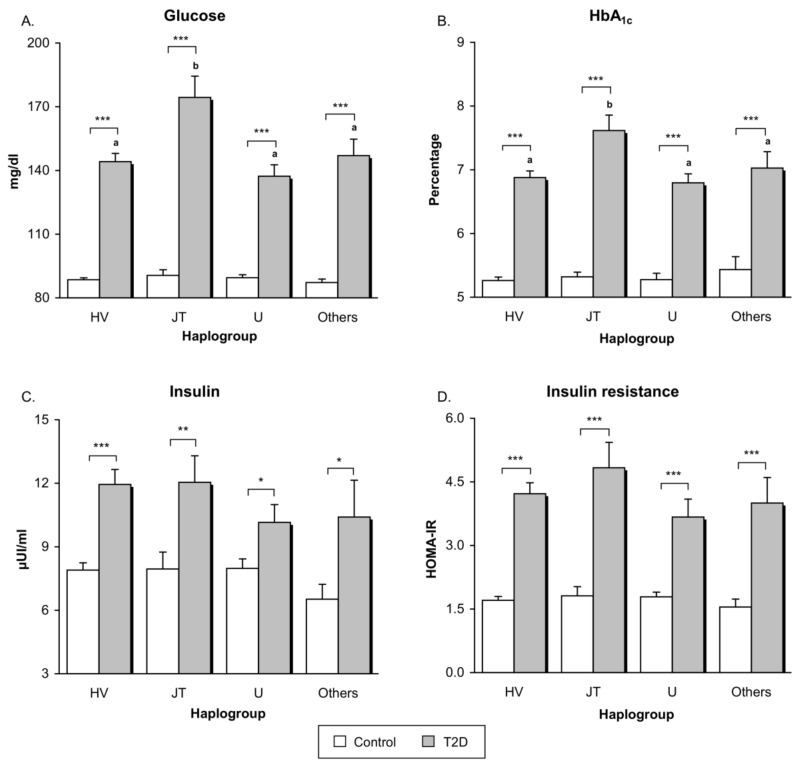
Figure 1.
Glycaemic control and insulin resistance-related parameters in healthy controls and type 2 diabetic patients belonging to the main mitochondrial macro-haplogroups. (A) Serum levels of fasting glucose (expressed as mg/dL); (B) Percentage of glycated haemoglobin (HbA1c) levels; (C) Serum levels of fasting insulin (μUI/mL); (D) HOMA-IR index calculated as [fasting insulin (μU/mL) × fasting glucose (mg/dL)]/405. Only patients not treated with insulin therapy are included in the graphs of fasting insulin and HOMA-IR. Grey bars show type 2 diabetic patients and white bars represent controls. * p < 0.05; ** p < 0.01; *** p < 0.001 when compared controls vs. type 2 diabetic subjects. Letters indicate significant differences among type 2 diabetic patients with different haplogroups (p < 0.05) when compared by means of one-way ANOVA followed by Student-Newman-Keuls post-hoc test (i.e., bars tagged with the same letter do not differ significantly from each other, while bars with no letter in common are significantly different from each other (p < 0.05)). Abbreviations: HbA1c, glycated haemoglobin; HOMA-IR, Homeostasis model assessment index of insulin resistance; T2D, Type 2 diabetes.

