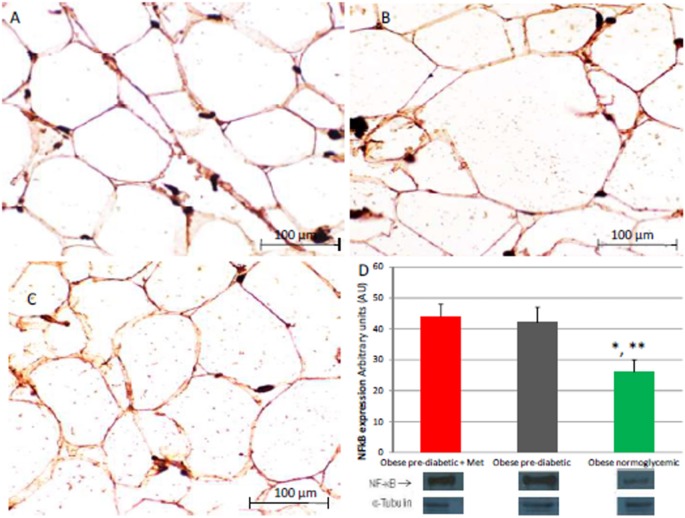
Figure 4.
Immunohistochemical detection of Nuclear Factor kappa-light-chain-enhancer of activated B cells (NFkB). Immunohistochemistry of obese patients with normo glycemic condition (group 3, in left upper part, A) vs. obese patient with pre-diabetic condition in metformin therapy (group 1, right upper part, B) vs. obese patient with pre-diabetic condition in placebo therapy (group 2, left lower part, C); In the right inferior part (D), bar graph expression and matched western blot expression of NFkB in obese patient with pre-diabetic condition in metformin therapy (group 1, red color), obese patient with pre-diabetic condition in placebo therapy (group 2, gray color), and obese patient with normo glycemic condition (group 3, green color). Protein levels are determined by Western blot analysis of adipose abdominal tissue homogenates from obese patients with normo-glycemic conditionand obesepatients with pre-diabetic condition. Inset, representative image of Western blot analysis (D). Lanes 1, obese patient with pre-diabetic condition in metformin therapy (group 1). Lanes 2, obese patient with pre-diabetic condition in placebo therapy (group 2). Lanes 3, obese patient with normo-glycemic condition (group 3). Results are mean ± SD of 5 independent experiments. Group 1 vs. group 3, *P <0.05; group 2 vs. group 3, **p <0.05.

