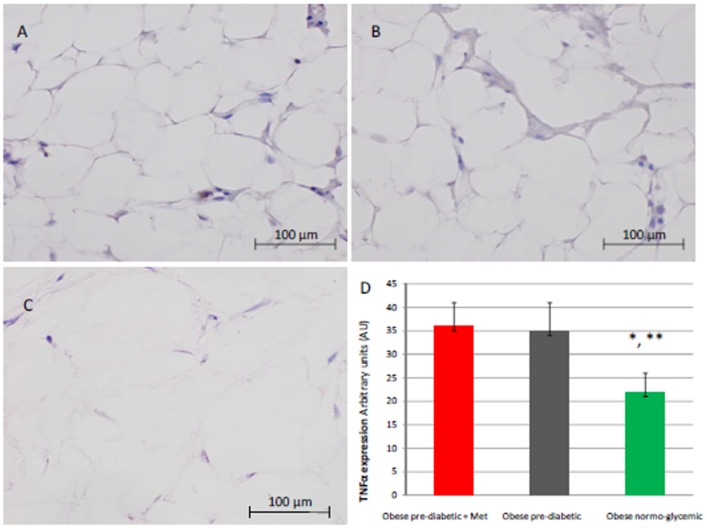
Figure 6.
Immunohistochemical detection of Tumor Necrosis factor alpha (TNFα). Representative images of TNFαimmunohistochemical detection in subcutaneous abdominal fat from obese patient with pre-diabetic condition and obese patient with normo-glycemic condition. Immunoistochemistry of obese patient with normo glycemic condition (group 3, in left upper part, A) vs. obese patient with pre-diabetic condition in metformin therapy (group 1, right upper part, B) vs. obese patient with pre-diabetic condition in placebo therapy (group 2, left lower part, C); In the right inferior part (D), expression of TNFα in obese patient with pre-diabetic condition in metformin therapy (group 1, red color), obese patient with pre-diabetic condition in placebo therapy (group 2, gray color), and in obese patient with normo glycemic condition (group 3, green color). Results are mean ± SD of 5 independent experiments. Group 1 vs. group 3, *P <0.05; group 2 vs. group 3, **p <0.05.

