FIGURE 4.
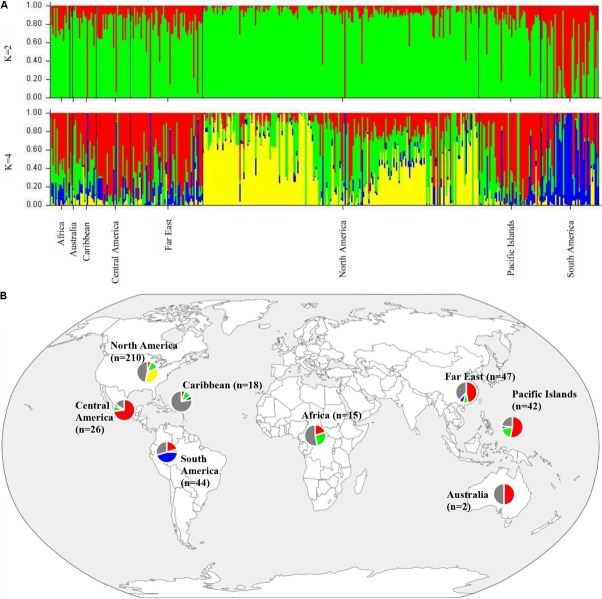
(A) Bar plots of Bayesian assignment probabilities for each Ipomoea batatas accession analyzed with 32,784 SNPs using the program STRUCTURE for 2 (K = 2) or 4 clusters (K = 4). The x-axis indicates accession and the y-axis indicates the assignment probability of that accession to each of the four clusters. Each vertical line represents an individual’s probability of belonging to one of K clusters (represented by different colors) or a combination of clusters if ancestry is mixed. (B) Map of the sampled regions for 417 Ipomoea batatas accessions. Pie charts correspond to the population assignment for the four genetic groups defined by the Bayesian assignment of STRUCTURE. Accessions were assigned to a cluster based on probabilities calculated in STRUCTURE, where C1 is red, C2 is green, C3 is blue, and C4 is yellow. A q-value threshold of 0.65 was used to divide the accessions into one of the four clusters or as admixed (gray section of pie charts).

