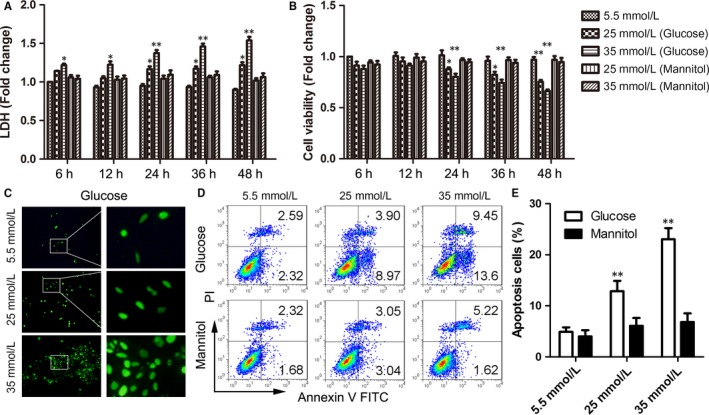
Figure 1.

High glucose‐induced H9C2 cell injury and apoptosis. A‐B, LDH (A) and MTS (B) assays were detected in H9C2 cells treated with high glucose for serial hours (6, 12, 24, 36 and 48 h). Mannitol was the control. C, DNA damage was detected through TUNEL in H9C2 cells treated with high glucose for 48 h. D‐E, Representative images of FCM of H9C2 cells treated with high glucose for 48 h (D) and the statistical result of apoptosis cells (E). Data are shown as mean ± SD. *P ≤ .05, **P ≤ .01
