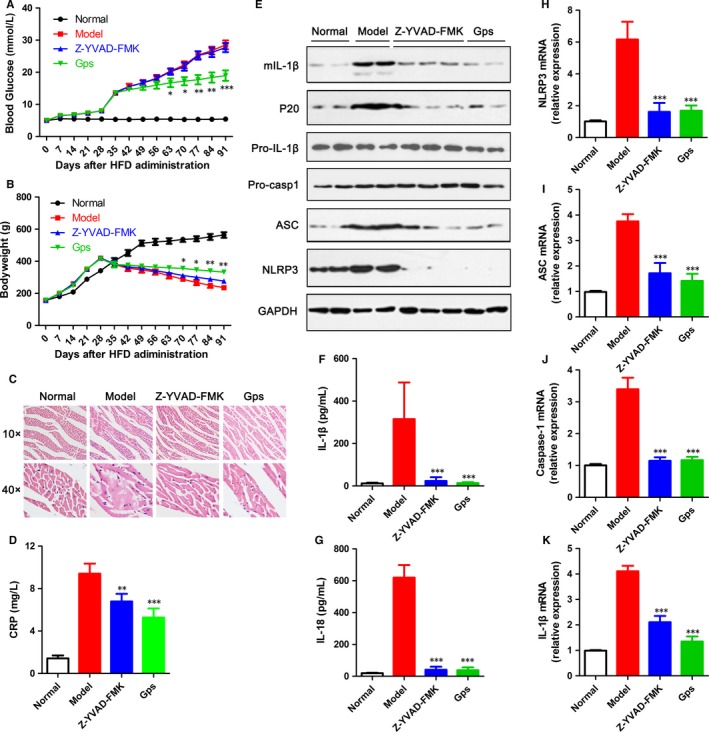
Figure 8.

Gps inhibited NLRP3 inflammasome activation and DCM development in vivo. A‐B, Blood glucose (A) and body weight (B) were measured every week for 13 wk after HFD administration. C, Myocardial tissue sections were stained with H&E fluid to detect myocardial injury. D, The level of CRP protein in the serum was analysed by ELISA. E, The levels of NLRP3 inflammasome markers were assayed via immunoblotting in myocardial tissue. F‐G, The levels of IL‐1β (F) and IL‐18 (G) proteins in serum were analysed by ELISA. H‐K, The gene levels of NLRP3 (H), ASC (H), caspase‐1 (G) and IL‐1β (K) were assayed via RT‐PCR in myocardial tissue. Data are shown as mean ± SD. *P ≤ .05, **P ≤ .01, ***P ≤ .001
