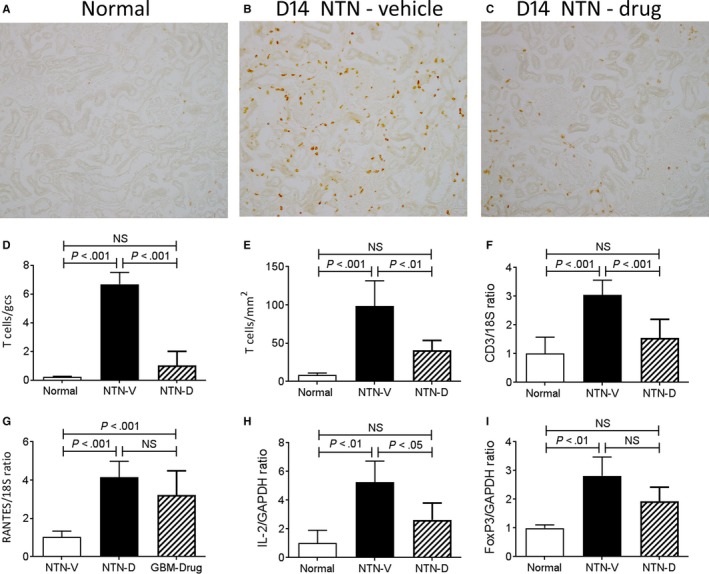
Figure 6.

T‐cell infiltration in day 14 nephrotoxic serum nephritis (NTN). Disease was induced in groups of 8 WKY rats which were treated with GS‐444217 (drug; NTN‐D) or vehicle (NTN‐V) alone. A‐C, Immunostaining for R73+ T cells: A, normal rat kidney; B, vehicle treated disease shows a substantial infiltrate of T cells in glomeruli and the interstitium; C, drug treatment shows a marked reduction in T‐cell infiltration in both compartments. Quantification of the number of R73+ T cells in: D, glomeruli, and (E) the interstitium. RT‐PCR analysis of mRNA levels for: F, CD3; G, CCL5; H, IL‐2, and; I, FoxP3. Data are mean ± SD. Analysis by one‐way ANOVA with Tukey's multiple comparison test
