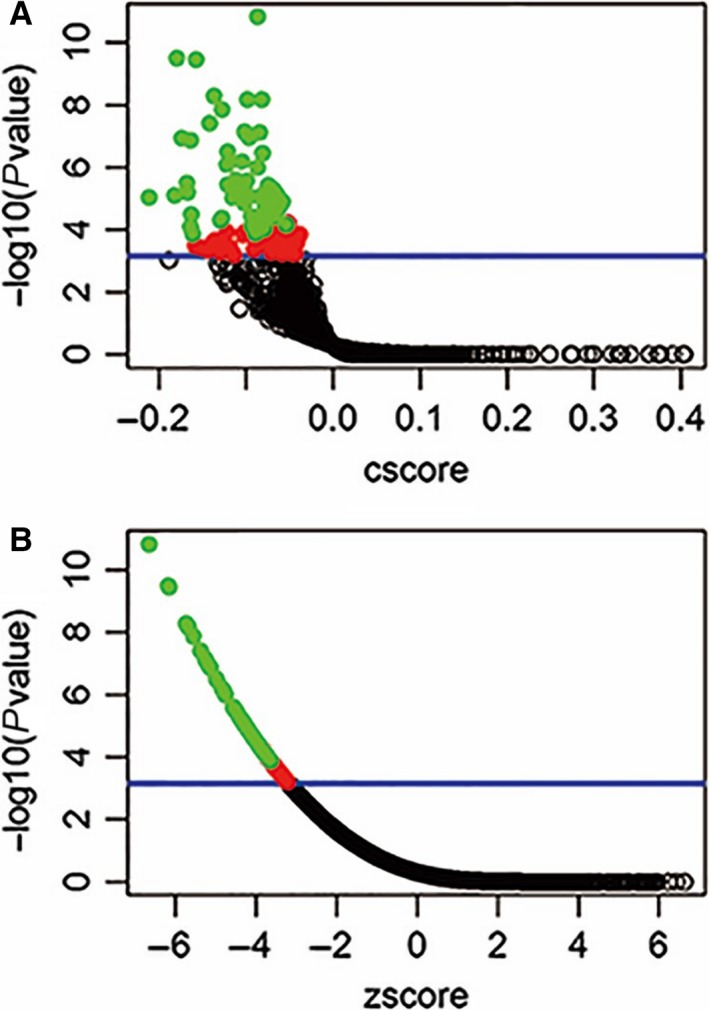
Figure 1.

Connectivity mapping of OPN gene signatures. Connectivity mapping shows the results of gene expression using the OPN gene signature as query to sscMap and the QUADrATiC collection of reference profiles for FDA approved drugs. The blue line in the figure represents the P‐value threshold (.0007) as described above, where it intersects the vertical axis at −log10(0.0007) = 3.16. The number of significant drugs (above the blue line, red or green spots) is 95, and the number of green spots (drugs with perturbation stability = 1) is 53, which all are listed in Table 1. The full results of connectivity mapping to all 1432 drugs can be found in Table S1
