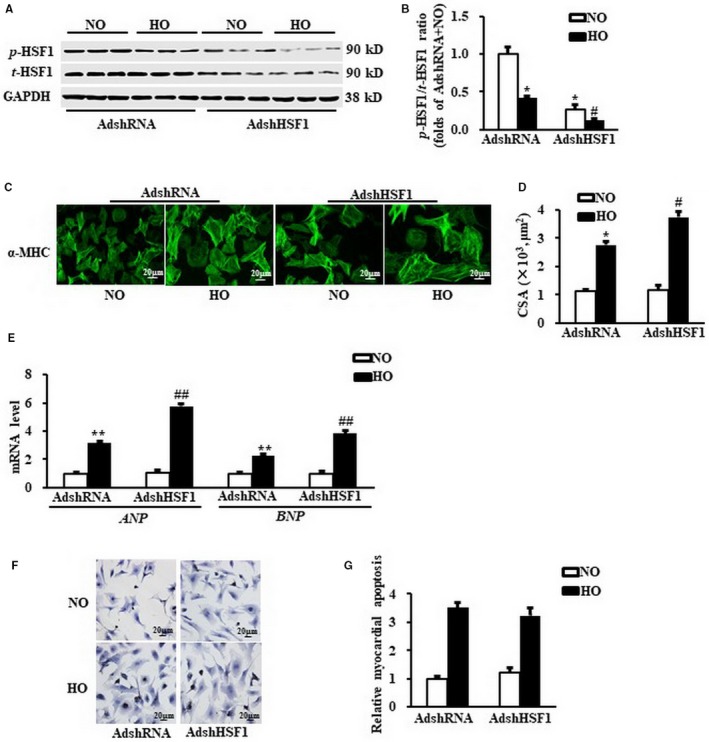
Figure 2.

Deficiency of HSF1 deteriorated hypoxia‐induced myocardial hypertrophy in vitro. A,. Representative Western blots of total and phosphorylation level of HSF1 in neonatal cardiomyocytes (NRCMs) after transduced with indicated SiRNA and treated with hypoxia. N = 5 independent experiments. B,. Quantitative results of total and phosphorylation level of HSF1in NRCMs. C and D,. The representative images and quantification data of cardiomyocyte surface area (CSA) of NRCMs stained by α‐myosin heavy chain (α‐MHC). Scale bar: 20 μm. E, mRNA levels of hypertrophic markers, atrial natriuretic peptide (ANP), B‐type natriuretic peptide (BNP) in NRCMs measured by real‐time PCR. GAPDH was served as internal control. F and G,. The TUNEL staining and quantified data of NRCMs. Scale bar: 20 μm. N = 5 independent experiments. NO, normoxia. HO, hypoxia. All data are expressed as mean ± SEM *P < .05 compared with NO + AdshSiRNA, # P < .05 compared with HO + AdshSiRNA
