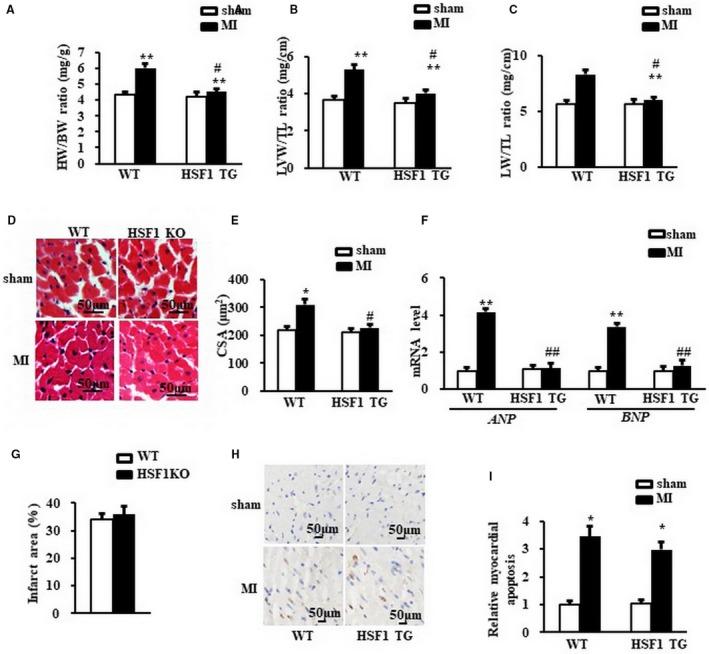
Figure 5.

Enhance of HSF1 attenuated cardiac hypertrophy induced by MI in mice. A, Heart weight/body weight ratio (HW/BW), (B) left ventricular weight/tibia length ratio (LVW/TL) and (C) lung weight/tibia length ratio (LW/TL) of mice. D, Representative images of histological sections of the mouse LVs were stained with haematoxylin‐eosin (H&E) 1 wk after MI or sham surgery. Scale bar: 50 μm. E, Quantitative results of the cross‐sectional area (CSA) of mouse cardiomyocytes quantified using an image analysis system. F, Real‐time PCR analysis of ANP and BNP in mouse border zone area of LVs 1 wk after MI. (G) The infarction size of the mouse hearts. H and I, The TUNEL staining and quantified data of mouse hearts. Scale bar: 50μm. GAPDH was served as internal control. N = 7 per experimental group. All data are expressed as mean ± SEM *P < .05, **P < .01 compared with WT sham, # P < .05, ## P < .01 compared with WT MI
