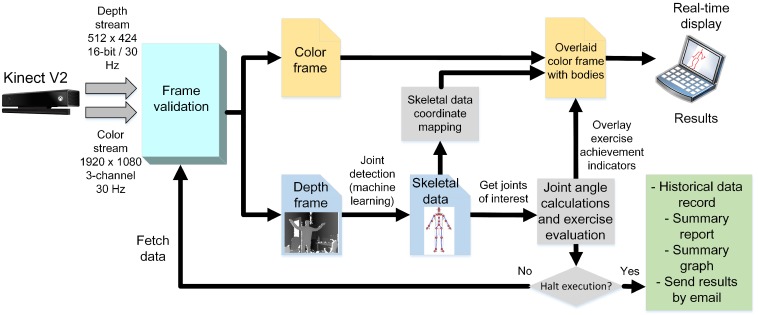
Figure 1.
HemoKinect flowchart describing the implemented methodology. The depth frames are processed to obtain the skeletal data from them using a machine learning algorithm, in particular a random decision forest [38]. The skeletal data are then mapped to the color image space using methods coded in Microsoft’s SDK. Then, the overlay image is obtained by drawing the bodies on top of the color image and adding the calculated angles’ achievement indicators. The process continues until the execution is halted. Finally, summary reports and graphs of the exercise are generated.

