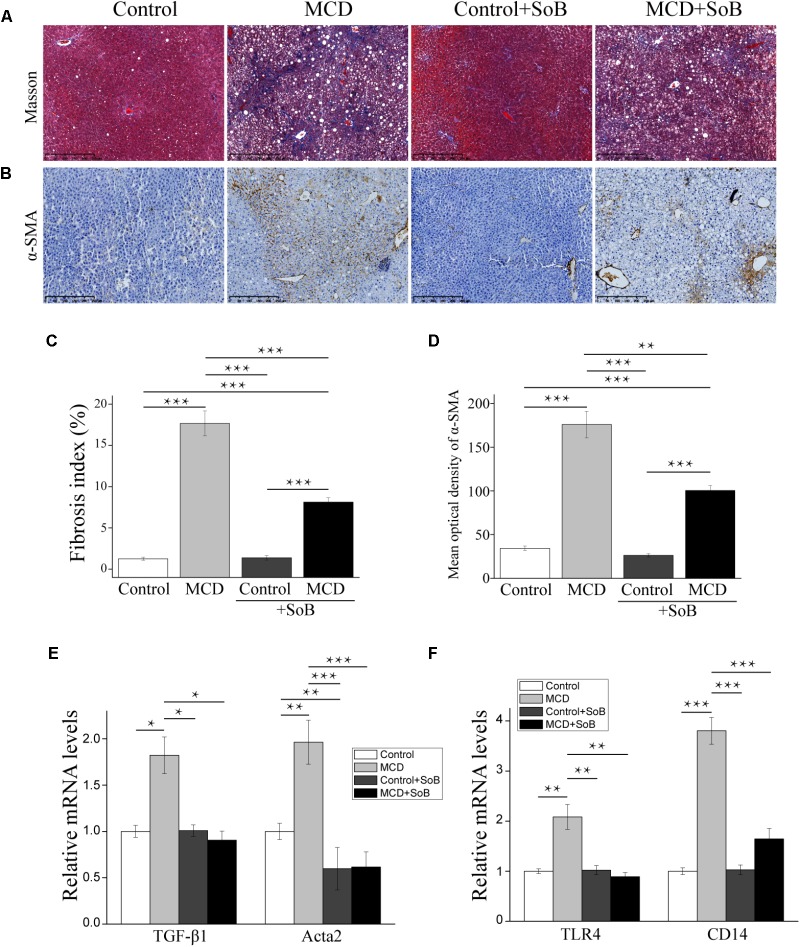
FIGURE 2.
Butyrate ameliorated liver fibrosis progression and regulated toll-like receptors. (A,B) Representative liver histology assessed by Masson’s trichrome staining (A) and α-SMA staining (B). Scale bar: 250 μm. (C) Percentage of Masson’s trichrome-stained area indicative of the fibrosis index (%). (D) Representative staining intensities for α-SMA as designated by the mean optical density. (E,F) Gene expression levels of the fibrosis marker TGF-β1, α-SMA encoding gene acta2 (E) and TLR4 and its co-receptor CD14 (F). Data are presented as the means ± SEM. N = 15–17 per group. ∗P < 0.05, ∗∗P < 0.01, and ∗∗∗P < 0.001 by one-way ANOVA with post hoc Tukey’s test.

