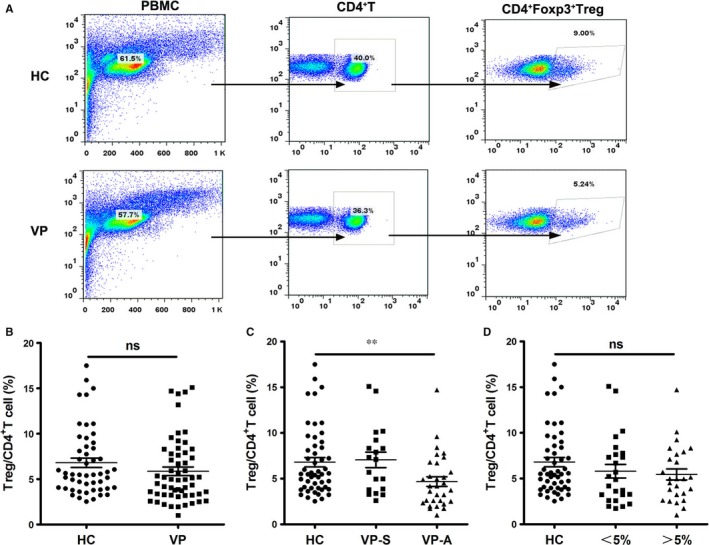
Figure 1.

Reduced Treg distribution in active vitiligo patients. (A) Representative FACS plots for vitiligo and control blood samples, CD4+Foxp3+T cell was used to identify Tregs. (B) The average percentage of Tregs was quantified and compared among control and vitiligo samples. (C) The percentage of Tregs was analysed in healthy controls and patients in different phases. (D) The percentage of Tregs was analysed in healthy controls and patients with different lesional skin area. Values are presented as the mean ± SD, **P < .01. ns, not significant; HC, healthy controls; VP, vitiligo patients; VP‐S, stable vitiligo patients; VP‐A, active vitiligo patients
